Chapter II: Financial Institutions: Soundness and Resilience - RBI - Reserve Bank of India


Chapter II: Financial Institutions: Soundness and Resilience
|
The Indian banking sector remained robust with capital buffers at a record high, non-performing loans ratios at multi-decadal low, and improved operational performance. Macro stress tests reaffirm the resilience of banks to adverse scenarios. The resilience of the NBFC sector is bolstered by enhanced asset quality and healthy capital buffers. Interconnectedness among financial sector entities, as reflected in their bilateral exposures, continued to grow in double-digits. Introduction 2.1 The Indian financial sector remained strong and resilient amidst global headwinds. Banks and non-banking financial companies (NBFCs) reinforced their capital and liquidity buffers, while improving their asset quality. Bank credit growth decelerated and moved closer to deposit growth, narrowing the gap between both. The credit expansion by NBFCs was supported by improving credit quality and strong capital buffers. A favourable interest rate environment, conditioned by monetary policy easing, is expected to catalyse credit offtake, going forward. 2.2 This chapter presents stylised facts and analyses on latest developments in the domestic financial sector. Section II.1 outlines the performance of scheduled commercial banks (SCBs) in India through various parameters, viz., business mix; asset quality; concentration of large borrowers; capital adequacy; earnings; and profitability. Results of macro stress tests, sensitivity analyses and bottom-up stress tests performed to evaluate the resilience of SCBs under adverse scenarios are also presented. Sections II.2 and II.3 examine the financial parameters of urban cooperative banks (UCBs) and NBFCs, respectively, including their resilience under various stress scenarios. Sections II.4, II.5 and II.6 examine the soundness and resilience of the mutual funds, clearing corporations and insurance sector, respectively. Section II.7 concludes the chapter with a detailed analysis of the network structure and connectivity of the Indian financial system as well as contagion analysis under stress scenarios. II.1 Scheduled Commercial Banks (SCBs)1 2 3 4 2.3 SCBs’ aggregate deposits grew at 10.7 per cent (y-o-y) during 2024-25, notwithstanding a deceleration in respect of private sector banks (PVBs) and foreign banks (FBs) (Chart 2.1 a). Growth in term deposits continued to outpace that in current and savings account deposits (Chart 2.1 b). As on June 13, 2025, SCBs’ y-o-y deposits growth stood at 10.5 per cent. 2.4 SCBs’ credit growth decelerated in 2024-25 across bank groups (Chart 2.1 c). Credit growth of public sector banks (PSBs) outpaced that of PVBs during the year, after more than a decade. As on June 13, 2025, y-o-y credit growth of SCBs moderated to 9.6 per cent. The shares of agricultural and industrial loans in aggregate credit have contracted, while those of services and personal loans have expanded over the last fiscal year (Chart 2.1 d). Growth (y-o-y) in agriculture, services and personal loans has moderated over the last few quarters, while a marginal uptick is observed in the growth of industrial loans in March 2025 (Chart 2.1 e). Personal loans segment recorded broad-based deceleration in y-o-y growth, barring an uptick in the growth of other personal loans (Chart 2.1 f). Personal loans and services loans continued to remain the top two contributors to the overall credit growth of SCBs (Chart 2.1 g). Within personal loans, other personal loans have been the standout contributor, followed by housing loans (Chart 2.1 h).   II.1.1 Asset Quality 2.5 SCBs continued to record improvement in their asset quality, with the GNPA ratio and NNPA ratio5 declining to multi-decadal lows of 2.3 per cent and 0.5 per cent, respectively (Chart 2.2 a and b). The half-yearly slippage ratio, measuring new accretions to NPAs as a share of standard advances at the beginning of the half-year, remained stable at 0.7 per cent (Chart 2.2 c). The provisioning coverage ratio (PCR)6 of SCBs at 76.3 per cent in March 2025 (Chart 2.2 d) was marginally lower than that in September 2024. The write-offs to GNPA ratio7 for SCBs moved up marginally to 31.8 per cent in 2024-25 from 29.5 per cent in the previous year, led by PVBs and FBs, while write-offs by PSBs exhibited a marginal decline (Chart 2.2 e). Disaggregation of NPA movements revealed that write-offs8 were a major component of NPA reduction over the last 5 years (Chart 2.2 f).   II.1.2 Sectoral Asset Quality 2.6 SCBs’ asset quality exhibited broad-based improvement across bank groups in all major sectors, in terms of both GNPA ratio and stressed advances ratio9 (Chart 2.3 a). Agriculture sector continued to record the highest GNPA ratio and was the major contributor to the overall stock of GNPA. In the personal loans segment, asset quality remained broadly stable across major subsegments (Chart 2.3 b). Within the industrial sector, asset quality exhibited sustained improvement across all sub-sectors (Chart 2.3 c).   II.1.3 Credit Quality of Large Borrowers10 2.7 The credit quality of larger borrowers has improved steadily over the last few years and their share in total GNPAs of SCBs stood at 37.5 per cent in March 2025, while their share in overall credit of SCBs stood at 43.9 per cent (Chart 2.4 a). The large borrower cohort’s GNPA ratio declined from 3.8 per cent in September 2023 to 1.9 per cent in March 2025 (Chart 2.4 b). On a quarter-on-quarter (q-o-q) basis, while volume of SMA-1 loans increased, that of SMA-0 and SMA-211 loans and NPAs declined during March 2025 quarter (Chart 2.4 c). Correspondingly, SMA-2 ratio of large borrowers, that rose significantly in September 2024, led by PSBs, recorded a sharp decline in March 2025 (Chart 2.4 d). The proportion of standard assets to total funded amount outstanding has consistently improved over the past few years, reaffirming the positive shift in asset quality (Chart 2.4 e). The share of top 100 borrowers in total advances of SCBs remained stable at 15.2 per cent in March 2025 and none of them were classified as NPA.   II.1.4 Capital Adequacy 2.8 As of March 2025, the capital to risk weighted assets ratio (CRAR) of SCBs increased to a record high of 17.3 per cent (Chart 2.5 a). All bank groups reported higher CRAR in March 2025, compared to their September 2024 positions. The increase in CRAR during the quarter ending March 2025 can be attributed to higher growth in total capital relative to the growth in RWA during this period (Chart 2.5 b). CET1 capital ratio also increased across bank groups, indicating accretion of high-quality capital by banks (Chart 2.5 c). The overall tier 1 leverage ratio12 remained stable at 7.9 per cent (Chart 2.5 d). II.1.5 Earnings and Profitability 2.9 The profitability of SCBs remained strong in 2024-25, with profit after tax (PAT) increasing by 16.9 per cent (y-o-y). PAT of PSBs recorded a robust growth of 31.8 per cent, compared to much lower growth (9.2 per cent) for PVBs. PSBs’ higher profitability was primarily driven by a rise in their other operating income. On the other hand, higher growth in operating expenses was the key contributor to the relatively lower profitability of PVBs (Chart 2.6 a). 2.10 Net interest margin (NIM) declined driven by cost of funds even as yield on assets has remained stable (Chart 2.6 b, c and d). Both return on equity (RoE) and return on assets (RoA) ratios have declined in March 2025 (Chart 2.6 e and f).    II.1.6 Liquidity 2.11 SCBs have further improved their liquidity positions in March 2025, as evident from the strengthening of both liquidity coverage ratio (LCR)13 and net stable funding ratio (NSFR)14. Both LCR and NSFR have been comfortably above the regulatory minimum of 100 per cent across bank groups (Chart 2.7 a and b).  II.1.7 Resilience – Macro Stress Tests 2.12 Macro stress tests aim to assess the resilience of the banking system15 to macroeconomic shocks. The tests project capital ratios of banks under three scenarios - a baseline and two adverse macro scenarios over a two-year horizon, incorporating credit risk, market risk and interest rate risk in the banking book in the framework. The capital projections do not take into account any further planned recapitalisation by stake-holders or any future regulatory changes. While the baseline scenario is derived from the forecasted path of macroeconomic variables, the two adverse scenarios16 are hypothetical stringent stress scenarios derived by performing simulations using a VARX17 model (Chart 2.8).  (i) Adverse Scenario 1 (Geopolitical risk scenario): This scenario assumes a volatile global environment with heightened geopolitical risks and escalation of global financial market volatility. Supply chain disruptions adversely affect the commodity prices leading to rise in domestic inflation. The scenario further assumes that the domestic monetary policy tightens and the spread between lending rates and policy rate widens due to market instability. (ii) Adverse Scenario 2 (Global growth slowdown scenario): This scenario assumes a synchronised sharp growth slowdown in key global economies. Spillovers through trade and financial channels as well as market fragmentation dent domestic GDP growth. As a result, monetary policy eases to support growth. The scenario further assumes widening of lending spread due to higher uncertainty. 2.13 The macro stress tests results emphasise the resilience of SCBs to macroeconomic shocks. The results revealed that the aggregate CRAR of 46 major SCBs may marginally dip to 17.0 per cent by March 2027 from 17.2 per cent in March 2025, under the baseline scenario. It may decline to 14.2 per cent under adverse scenario 1, and to 14.6 per cent under adverse scenario 2. However, none of the banks would fall short of the regulatory minimum requirement of 9 per cent even under the adverse scenarios (Chart 2.9). 2.14 The CET1 capital ratio of the select 46 banks may rise from 14.6 per cent in March 2025 to 15.2 per cent by March 2027 under the baseline scenario. However, it may fall to 12.5 per cent under adverse scenario 1, and to 12.9 per cent under adverse scenario 2. None of the banks would breach the regulatory minimum requirement of 5.5 per cent under any of these scenarios (Chart 2.10).   2.15 The aggregate GNPA ratio of the 46 banks may marginally rise from 2.3 per cent in March 2025 to 2.5 per cent in March 2027 under the baseline scenario and to 5.6 per cent and 5.3 per cent, under adverse scenario 1 and adverse scenario 2, respectively (Chart 2.11).  II.1.8 Sensitivity Analysis18 2.16 Unlike macro stress tests, in which the shocks are applied in terms of adverse macroeconomic conditions, in sensitivity analyses, shocks are applied to single factors like GNPA, interest rate, equity prices and deposits, one shock at a time. This sub-section presents the results of top-down sensitivity analyses involving several single-factor shocks to assess the vulnerabilities of SCBs to simulated credit, interest rate, equity and liquidity risks under various stress scenarios19, based on their March 2025 position. a. Credit Risk 2.17 Credit risk sensitivity has been analysed under two scenarios wherein the system level GNPA ratio as of March 2025, is assumed to rise from its prevailing level by (i) one standard deviation (SD)20; and (ii) two SD in a quarter. Under a severe shock of two SD: (a) the aggregate GNPA ratio of 46 select SCBs moves up from 2.3 per cent to 7.9 per cent; (b) the system-level CRAR depletes by 370 bps from 17.2 per cent to 13.5 per cent; and (c) the CET1 capital ratio declines from 14.6 per cent to 11.0 per cent but remains well above the respective regulatory minimum levels. The system level capital impairment could be 22.6 per cent in this case (Chart 2.12 a). The reverse stress test showed that a shock of 4.6 SD would be required to bring down the system-level CRAR below the regulatory minimum of 9 per cent. A shock of 6.6 SD will be required to bring down the system-level CET1 capital ratio below the prescribed regulatory minimum of 5.5 per cent. Bank-level stress tests indicated that under the severe shock scenario (two SD), three banks with a share of 6.1 per cent in SCBs’ total assets may breach the regulatory minimum level of CRAR (Chart 2.12 b).  b. Credit Concentration Risk 2.18 Stress tests on banks’ credit concentration – considering top individual borrowers according to their standard exposures – show that in the extreme scenario of the top three individual borrowers of respective banks defaulting21, the system level CRAR would decline by 90 bps (Chart 2.13) and no bank would face a situation of a drop in CRAR below the regulatory minimum of 9 per cent. In this extreme scenario, four banks would experience a fall of more than two percentage points in their CRARs. 2.19 Under the extreme scenario of the top three group borrowers in the standard category failing to repay22, the system level CRAR would decline by 130 bps. No bank would witness a drop in CRAR below the regulatory minimum of 9 per cent (Chart 2.14).   2.20 In the extreme scenario of the top three individual stressed borrowers of respective banks failing to repay23, the system level CRAR would decline by 10 bps (Chart 2.15).  2.21 Credit concentration risk assessment, described above, evaluates banks’ resilience by considering defaults of top individual or group borrowers of respective banks and estimating impact on their CRARs. While this approach presents a conservative scenario by assuming that top borrowers of all banks default simultaneously, it does not explicitly capture the system-wide impact which a large borrower can cause as multiple banks can have exposure to a single entity. Box 2.1 provides a complimentary approach to address this scenario.
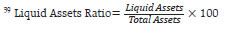
c. Sectoral Credit Risk 2.22 Shocks applied based on volatility of industry sub-sector-wise GNPA ratios indicate varying magnitudes of impact. By and large, sectoral credit risk remains muted — a two SD shock to basic metals and energy sub-sectors would reduce the system-level CRAR by 17 bps and 12 bps, respectively, whereas the impact of shocks on the rest of the sub-sectors is negligible (Table 2.1). 2.23 For the sample of 46 SCBs under assessment, the market value of investments subject to fair value has been on the rise and stood at ₹23.8 lakh crore in March 2025. Within the fair-valued investment portfolio, SCBs increased their allocation under the ‘fair value through profit and loss (FVTPL)’ category to 37.0 per cent in March 2025, and the remaining fair value portfolio (63.0 per cent in March 2025) was under the ‘available for sale (AFS)’ category. The rise in the share of the FVTPL portfolio under the revised framework29 is primarily attributable to a clearly identifiable held for trading (HFT) book which accounted for 90.9 per cent of the FVTPL portfolio. PSBs’ share in the fair-valued investment portfolio of SCBs continued its decreasing trend in the post-pandemic period with a sharp fall recorded immediately after framework revision, while the share of other bank groups witnessed an increasing trend (Chart 2.16).  Portfolios: Bank-group wise") 2.24 Though the modified duration increased, the sensitivity (PV0130) of the AFS portfolio of SCBs diminished in March 2025, predominantly on account of decrease in AFS portfolio size as compared to September 2024. The PV01 of FVTPL (including HFT) portfolios of all banking groups increased because of a significant increase in market value of securities held in the portfolio (Table 2.2). The modified duration of the FVTPL portfolio decreased for all the banking cohorts. Variation in PV01 was higher for FBs. 2.25 An assessment of the impact of a parallel upward shift of 250 bps in the yield curve on the fair-valued portfolio (AFS and FVTPL (including HFT)) showed that the system level CRAR and CET1 capital ratio would reduce by 115 and 116 bps, respectively (Table 2.3). 2.26 All banking cohorts reported a sequential rise in trading profits in Q4:2024-25. The earnings from securities trading by PSBs and FBs was significant, as in the previous year, strengthening net operating income (Table 2.4). 2.27 Both the PSBs and PVBs have increased their holding of state development loans (SDLs)/ state government securities (SGSs) while paring their holdings in central government securities (G-Secs) and other HTM-eligible securities (Chart 2.17). 2.28 As at end-March 2025, the notional MTM gains in the HTM books of PSBs and PVBs together increased to ₹64,148 crore from ₹40,187 crore in September 2024. During the March 2025 quarter, unrealised gains rose across all categories of HTM book, benefiting from the falling yield curve. The unrealised gains of PSBs were predominantly in SDLs/ SGSs, as against those in G-Secs for PVBs (Chart 2.18).  2.29 If a shock of 250 bps parallel upward shift in the yield curve is applied, the MTM impact on the HTM portfolio of banks excluding unrealised gains/losses would reduce the system level CRAR and CET1 capital ratio by 313 bps each. However, no bank would witness a reduction in CRAR and CET1 capital ratio below the respective regulatory limits. 2.30 An assessment of the interest rate risk of banks31 using traditional gap analysis (TGA) on the rate sensitive global assets and liabilities and off-balance sheet items as of March 2025 showed that in a scenario of a 200 bps increase in interest rate, the earnings at risk (EAR) for PSBs and PVBs would be 13.3 per cent and 11.4 per cent of NII, respectively (Table 2.5). The impact would be minimal for FBs and SFBs. While the impact of an interest rate rise (fall) on earnings would be positive (negative) for PSBs, PVBs and FBs due to positive cumulative gap32 at bank group level, the impact for SFBs would be the opposite as the cumulative gap was negative.  2.31 As per the duration gap analysis33 (DGA) on the rate sensitive global assets, liabilities and off-balance sheet items, the market value of equity (MVE) for PVBs, FBs and SFBs would fall (rise) from an upward (downward) movement in the interest rate, while the effect on PSBs would be muted and the opposite. The MVE for SFBs would be particularly weighed down by an interest rate rise (Table 2.6). e. Equity Price Risk 2.32 As banks have limited direct capital market exposures owing to regulatory prescriptions, any impact of a possible significant fall in equity prices on banks’ CRAR would be low for the sample of 46 banks. Under scenarios of 25 per cent, 35 per cent and 55 per cent drop in equity prices, the system level CRAR would reduce by 25 bps, 35 bps and 55 bps, respectively (Chart 2.19 a). In the adverse scenario (shock 3), the lowest CRAR at bank level would be 13.6 per cent (Chart 2.19 b). Even if the entire capital market exposure is wiped out, the system level CRAR declines by 100 bps and CRARs of individual banks remain above the regulatory minimum level.  f. Liquidity Risk 2.33 Liquidity stress test attempts to assess the impact of a shock on liquidity positions of the select 46 SCBs, caused by plausible run on deposits, and increased demand for unutilised portions of committed credit and liquidity facilities. The baseline scenario for the stress test applies weights to each component as prescribed by the RBI guidelines on LCR computation34. Two stress scenarios are designed by applying higher weights (run-off rates) to certain cash outflow components35. The results showed that the aggregate LCR of the SCBs would fall from 132.1 per cent in the baseline scenario to 124.5 per cent in stress scenario 1 and further to 117.9 per cent in stress scenario 2 (Chart 2.20 a). Individually, all banks would be able to maintain LCR above the minimum requirement of 100 per cent in stress scenario 1, while one bank would marginally fall short to meet the same in stress scenario 2 (Chart 2.20 b).  II.1.9 Sensitivity Analysis of Small Finance Banks 2.34 Small Finance Banks (SFBs) consist of 11 entities whose collective share in total credit and total deposits36 are 1.5 per cent and 1.4 per cent, respectively, as of end-March 2025. Because of their small size, they are not represented in the list of 46 banks on which sensitivity analyses is typically performed. However, similar sensitivity analyses on credit risk and credit concentration risk performed separately for SFBs show that each SFB would remain resilient under stress scenarios. II.1.10 Bottom-up Stress Tests: Derivatives Portfolio 2.35 A series of bottom-up stress tests (sensitivity analyses) were conducted by select banks37, subjecting their derivatives portfolios as of March 2025 to four different shocks viz. two each based on interest rate and foreign exchange rate. In line with the trend observed in the recent past, the FBs maintained a significantly negative net MTM position as a proportion to CET1 capital at (-) 17 per cent in March 2025 compared with (-) 6 per cent in September 2024. For PSBs and PVBs, net MTM position was muted (Chart 2.21). For the overall system, the extent of negative MTM position increased in the half-year ending March 2025. 2.36 The impact of the interest rate shocks on the derivatives portfolios of the select banks, in terms of change in net MTM position, was found to increase in March 2025 over that in September 2024. The stress test results on the portfolios as of March 2025 showed that for the select banks, gain from an interest rate rise would be higher than loss from an interest rate fall of similar magnitude (Chart 2.22). As regards shocks of the rupee exchange rate on exposures to forex derivatives, the impact was noted to be reversed in March 2025 from that seen in September 2024.  2.37 The income from the derivatives portfolio includes changes in net MTM positions and the realised income. The contribution of the derivatives portfolio to the net operating income (NOI) of banks has increased significantly for all the bank groups in March 2025 as compared to September 2024. In particular, the realised income of FBs from derivatives portfolio formed a reasonable portion of their NOI despite their net negative MTM positions (Chart 2.23). Based on the notional principal amount, FBs had more diversified counterparties while most of the positions taken by PVBs and PSBs were with other banks.   II.1.11 Bottom-up Stress Tests: Credit, Market and Liquidity Risk 2.38 A suite of bottom-up stress tests (sensitivity analyses) was conducted by 37 select banks38 on their end-March 2025 position. The results affirmed the resilience of these banks to multiple types and magnitudes of shocks. All the sample banks would be able to meet the regulatory minimum requirement of CRAR under these scenarios (Chart 2.24).  2.39 The bottom-up stress test for liquidity risk revealed that liquid assets ratios39 of all the sample banks would remain positive under alternate shock scenarios, emphasising the adequacy of their HQLAs to withstand liquidity pressure from sudden and unexpected withdrawal of deposits. Under the scenarios of (i) a 10 per cent deposit run-off in 1-2 days and (ii) a 3 per cent deposit run-off for five consecutive days, the average liquid assets ratio of the select banks would drop from 23.0 per cent to 16.2 per cent and 12.5 per cent, respectively (Chart 2.25).  II.2 Primary (Urban) Cooperative Banks (UCBs)40 2.40 Credit extended by primary urban cooperative banks (UCBs)41 registered a higher y-o-y growth of 7.4 per cent in March 2025 than that in March 2024 (Chart 2.26 a). Both scheduled UCBs (SUCBs) and non-scheduled UCBs (NSUCBs) witnessed acceleration in credit growth. 2.41 The capital position of UCBs continued to strengthen in the post-pandemic period, with their CRAR rising to 18.0 per cent in March 2025. The strengthening of capital position has been broad based - across SUCBs and NSUCBs, as well as across all tiers42 - barring marginal dip for the Tier 1 UCBs (Chart 2.26 b and c). 2.42 The GNPA and NNPA ratios of UCBs, both SUCBs and NSUCBs, decreased significantly in March 2025 compared to September 2024 (Chart 2.26 d and e). A similar trend was observed in the GNPA ratio of large borrowers who account for 23.2 per cent of the UCBs’ loan book (Chart 2.26 f). The PCR also improved, rising from its levels in both March and September 2024, driven primarily by NSUCBs (Chart 2.26 g). Asset quality of UCBs improved across all tiers, alongside increase in PCR (Chart 2.26 h).    2.43 UCBs’ net interest margin remained the same in March 2025 as in September 2024, though it was slightly lower than the level recorded a year earlier (Charts 2.26 i). The RoA and RoE, however, declined compared to September 2024 as well as from their levels a year ago (Charts 2.26 j and k). In terms of tier-wise performance, RoA and RoE declined for Tier 1 and Tier 4 UCBs in March 2025, while both indicators saw an increase for Tier 2 UCBs (Chart 2.26 l). II.2.1 Stress Testing 2.44 Stress tests were conducted on a select set of UCBs43 to assess credit risk (default risk and concentration risk), market risk (interest rate risk in trading book and banking book) and liquidity risk, based on their reported financial positions as of March 2025. 2.45 Under the severe stress scenario of credit default risk, credit concentration risk and interest rate risk in the trading book, the system level CRAR would reduce from the pre-shock position of 17.4 per cent to 15.6 per cent, 14.1 per cent and 16.4 per cent, respectively. A severe interest rate shock in the banking book would reduce NII by 7.0 per cent at the system level. At the system level, the consolidated cumulative liquidity mismatch in 1-28 days’ time bucket would remain positive under severe stress. 2.46 One bank in the Tier 4 UCB sample - the largest category of UCBs with deposits above ₹10,000 crore - would not be able to meet the regulatory minimum requirement44 of 11 per cent CRAR under a severe stress scenario for credit default risk as well as for credit concentration risk. For Tier 2 and Tier 3 UCBs, the impact of credit risk and credit concentration risk under severe stress would be significant (Chart 2.27 a and b). None of the Tier 1 and Tier 4 UCBs would breach regulatory thresholds on CRAR under the interest rate shock scenarios applied to their trading book or face more than 20 per cent decline in NII from their banking books. Further, the impact on UCBs in other tiers would remain minimal (Chart 2.27 c and d). The smallest UCBs (Tier 1) exhibited resilience for all risk factors, except liquidity risk (Chart 2.27 e).   II.3 Non-Banking Financial Companies (NBFCs)45 2.47 The credit growth of NBFCs (Upper and Middle Layers) rose to 20.7 per cent (y-o-y) in March 2025 from 16.0 per cent in September 2024 but remained lower than the level observed in September 2023 (Chart 2.28 a). The acceleration in credit growth in March 2025 compared to the preceding half-year was driven by NBFC-UL. The surge in credit growth of NBFC-UL was partly on account of conversion of a housing finance company (HFC) to an upper layer NBFC, and merger of a middle layer NBFC with an upper layer NBFC. 2.48 Considering activity-based classification, credit growth for the second largest category of NBFCs (in terms of outstanding loans), viz., NBFC-IFCs has risen, vis-à-vis March 2024. NBFC-MFI’s portfolio contracted in H2:2024-25 as lenders exercised prudence in response to the stress in the portfolio (Chart 2.28 b).   2.49 Credit growth weakened across all major sectors excluding services and 'others', in H2:2024-25 (Chart 2.28 c). The credit in agriculture sector contracted. The rate of credit expansion by the NBFC-ML significantly declined across sectors in 2024-25, except 'others' category. 2.50 Credit growth in the unsecured personal loan segment has slowed down significantly since September 2023. Microfinance/SHG loans within the retail advances category has contracted in March 2025. Gold loans, on the other hand, have clocked rapid growth since September 2023 (Chart 2.29).  2.51 Delinquency level in both NBFC-UL and NBFC-ML improved (Chart 2.30 a). NBFC-ML continued to maintain higher PCR than NBFC-UL (Chart 2.30 b). GNPA ratio of Government-owned NBFCs (58.7 per cent share in advances by NBFC-ML) improved to 1.4 per cent while that of privately owned NBFCs of NBFC-ML remained at similar level (5.2 per cent) as in September 2024. At sectoral level, asset quality improved except in agriculture which contributed 3.4 per cent of the NBFCs’ GNPA (Chart 2.30 c). 2.52 The system level CRAR of NBFCs was healthy at 25.8 per cent in March 2025. NBFC-UL were consistently maintaining an elevated NIM at around 8 per cent, as against around 4 per cent by NBFC-ML. Consequently, profitability of NBFC-UL was much higher than that of NBFC-ML in terms of ROA and ROE. Profitability of NBFC-ML has declined significantly in H2:2024-25 as a few large MFIs in this layer recorded significant amount of loss in the second half of the year (Chart 2.31). 2.53 On the liquidity front, upper layer NBFCs were more vulnerable, given that they had a higher proportion of short-term liabilities to total assets in comparison with NBFC-ML. The share of long-term assets in total assets of NBFC-UL stood at 55.0 per cent as against nearly two-thirds for NBFC-ML. Higher share in case of NBFC-ML is due to the presence of NBFC-IFCs in this layer which predominantly lend for longer term projects and account for more than half of NBFC-ML’s loans (Chart 2.32).   2.54 The reliance of NBFCs on bank funding decreased over the last year as the impact of higher risk weight on bank lending to NBFCs played out. Dependence of NBFC-UL on bank borrowings and public deposits was higher than NBFC-ML (Table 2.7). II.3.1 Stress Test46 - Credit Risk 2.55 System level stress test under a baseline and two stress scenarios was conducted on a sample of 158 NBFCs47 over a one-year horizon for assessing the resilience of NBFC sector to credit risk shocks. While the baseline scenario was based on assumptions of business as usual, the medium and severe risk scenarios were derived by applying 1 SD and 2 SD shocks, respectively, to GNPA ratio.  2.56 Under the baseline scenario, the system-level GNPA ratio of the sample NBFCs may rise from 2.9 per cent in March 2025 to 3.3 percent in March 2026. Consequently, their aggregate CRAR may dip to 21.4 per cent in March 2026 from 23.4 per cent in March 2025 (Chart 2.33). Under the baseline scenario, 10 NBFCs (all in middle layer) having a share of 2.1 per cent of total advances of all NBFCs (UL + ML) may breach the regulatory minimum capital requirement of 15 per cent. Under the medium and severe risk scenarios, income loss and additional provision requirements may further reduce the CRAR compare to the baseline by additional 80 bps and 100 bps, respectively. Under the high-risk scenario, fifteen NBFCs (all in middle layer), having a share of 3.7 per cent of total advances of all NBFCs (UL + ML), may not be able to meet the regulatory minimum CRAR.  II.3.2 Stress Test48 - Liquidity Risk 2.57 The resilience of the NBFC sector to liquidity shocks was assessed by estimating the impact of assumed increase in cash outflows coupled with decline in cash inflows49. The results revealed that number of NBFCs which may experience negative cumulative liquidity mismatch of over 20 per cent in the next one year would be 1, 2 and 3 under the three scenarios, respectively (Table 2.8). II.4 Stress Testing of Mutual Funds 2.58 The Securities and Exchange Board of India (SEBI) has mandated that asset management companies (AMCs) should carry out stress testing of all open-ended debt schemes (except overnight schemes) every month to evaluate the impact of various risk parameters (viz., interest rate risk, credit risk, liquidity risk) related to such schemes on their net asset values (NAVs). The Association of Mutual Funds in India (AMFI) and each AMC specify the thresholds of impact for the risk parameters: breach of either the AMFI or the AMC threshold requires reporting and remedial action. 2.59 In April 2025, risk level of 43 open-ended debt schemes with total assets under management (AUM) of ₹2.25 lakh crore breached the AMFI or AMC prescribed threshold (Table 2.9). In this respect, all the mutual funds (MFs) have reported initiation of remedial action to be completed within the prescribed timeframe. 2.60 Furthermore, as part of liquidity risk management for open-ended debt schemes, two types of liquidity ratios, viz., (i) redemption at risk (LR-RaR), which represents likely outflows at a given confidence interval, and (ii) conditional redemption at risk (LR-CRaR), which represents the behaviour of the tail at the given confidence interval, have been used. All AMCs are mandated to maintain these liquidity ratios above the threshold limits which are derived from scheme type, scheme asset composition and potential outflows (modelled from investor concentration in the scheme). MFs are required to carry out backtesting of these liquidity ratios for all open-ended debt schemes (except overnight funds, gilt funds and gilt funds with 10-year constant duration) on a monthly basis. 2.61 The LR-RaR and LR-CRaR computed by top 10 AMCs (based on AUM) for 13 categories of open-ended debt schemes for March 2025 were well above the respective threshold limits for most of the MFs. A few instances of the ratios falling below the threshold limits were addressed by the respective AMCs in a timely manner (Chart 2.34). 2.62 Stress tests results and liquidity analysis of midcap and smallcap equity schemes of all MFs, published by AMFI, reveal that in April 2025, the number of days to liquidate 25 per cent of the portfolio for the top 5 schemes (in terms of AUM) ranged from 4 to 20 days for midcap schemes and 13 to 35 days for smallcap schemes (Table 2.10). II.5 Stress Testing Analysis at Clearing Corporations 2.63 Stress testing50 has been carried out at clearing corporations (CCs) to determine the segment-wise minimum required corpus (MRC), which needs to be contributed by clearing members (CMs) to the core settlement guarantee fund (Core SGF). MRC is determined for each segment (viz., equity cash, equity derivatives, currency derivatives, commodity derivatives, debt and tri-party repo segment) every month, based on stress testing. / Deficit (-)) of LR-RaR and LR-CRaR Maintained by AMCs over AMFI Prescribed Limits") 2.64 The actual MRC for any given month is determined as the higher of the MRC of the month and the MRC arrived at any time in the past. Stress test analysis for the half-year during October 2024 to March 2025 indicated that the actual MRC requirement remained the same for most of the segments, except for the equity derivatives segment wherein the MRC requirement increased significantly due to the revised Circular by SEBI ensuring higher buffer to the probable losses in more adverse scenarios51 (Table 2.11). 2.65 The solvency ratio of an insurance company assesses the ability of the insurer to meet its obligations towards policyholders by reflecting the level of its assets over and above its liabilities. The minimum solvency ratio prescribed by the Insurance Regulatory and Development Authority of India (IRDAI) for insurance companies in India is 150 per cent. As insurance liabilities are contingent upon future events, a higher solvency ratio implies resilience of the insurer to withstand future uncertainties. 2.66 As of December 2024, and the previous three quarters, the aggregate solvency ratio for insurance companies remained above the prescribed threshold (Table 2.12). The solvency ratio of the life insurance companies remained at 204 per cent, while non-life insurance companies maintained a solvency ratio of 166 per cent as of December 2024. 2.67 Interconnections among financial institutions involve funding gaps arising due to liquidity mismatches and maturity transformation, payments processes, and risk transfer mechanisms. The financial system can be visualised as a network where financial institutions act as nodes and the bilateral exposures among them serve as links connecting these nodes. These links could be in the form of loans to, investments in, or deposits with each other, which act as a source of funding, liquidity, investment and risk diversification. While these links enable gains in efficiency and diversification of risks, they can become conduits of risk transmission and amplification in a crisis. Understanding the nuances in propagation of risk through networks is useful for devising appropriate policy responses for safeguarding financial and macroeconomic stability. II.7.1 Financial System Network52 53 2.68 The total outstanding bilateral exposures54 among the select 229 entities in the Indian financial system expanded at a growth rate of 19.6 per cent in March 2025 (Chart 2.35 a and b). 2.69 Long-term (LT) funding – primarily loans and advances, equity and LT debt instruments – was the key conduit for bilateral exposure in the system (Chart 2.36). A segment-wise analysis indicates that, in general, (a) LT loans continued to be mainly provided by SCBs to NBFCs; (b) AMC-MFs continued to be major investors in the equities issued by PVBs and NBFCs; (c) in the LT debt market, insurance companies held majority of instruments issued by PVBs, NBFCs and HFCs. In short-term (ST) funding, the inter-bank ST loans and deposits, CPs and CDs continued to be dominant. AMC-MFs continued to be the largest providers of funds in both the CP and CD markets. While AIFIs, NBFCs and HFCs were the largest receivers of fund in the CP market, PSBs, PVBs and AIFIs were the largest receivers in the CD market.   2.70 In terms of inter-sectoral net exposures55, AMC-MFs, insurance companies and PSBs remained the largest fund providers in the system and NBFCs, PVBs and HFCs were the largest receivers of funds. Among bank groups, PSBs and UCBs had net receivable positions whereas PVBs, FBs and SFBs had net payable positions vis-à-vis the entire financial sector (Chart 2.37).  2.71 The net receivable and net payable positions of leading fund providers and receivers recorded a gradual rise in March 2025 over a year ago (Chart 2.38). / Payables (-ve) by Institutions") a. Inter-Bank Market 2.72 Inter-bank exposures stood at 3.4 per cent of the total assets of the banking system in March 2025, at around the same level as in the past quarters. During H2:2024-25, fund-based exposure witnessed a significant increase, though its share in total bank assets remained stagnant, while non-fund-based exposures rose marginally (Chart 2.39).  2.73 PSBs continued to dominate the inter-bank market with more than 50 per cent share. The share of PSBs and FBs moderated with corresponding increase in the share of PVBs in H2:2024-25 (Chart 2.40).  2.74 Contrary to the dominance of the LT fund-based exposures in the overall financial network, the inter-bank market continued to rely heavily on ST funding – to the tune of 77 per cent of the fund-based inter-bank market as of March 2025. ST deposits and ST loans constituted more than 70 per cent of ST funds, while LT loans and LT Debt comprised a major share of LT funds (Chart 2.41 a and b).  b. Inter-Bank Market: Network Structure and Connectivity 2.75 The interconnection between entities in the inter-bank market network was highly skewed, with majority of banks having few links and few banks having many links, as reflected by the typical core-periphery network structure56 57. As of end-March 2025, one bank was in the inner-most core and nine banks in the mid-core circle consisting of PSBs and PVBs (Chart 2.42).  – March 2025") 2.76 While the degree of interconnectedness among SCBs, measured by the connectivity ratio, remained unchanged in H2:2024-25, their local interconnectedness in terms of the cluster coefficient increased marginally (Chart 2.43). ") c. Exposure of AMCs-MFs 2.77 Gross receivables of AMC-MFs, the largest fund providers, stood at ₹20.68 lakh crore (around 32 per cent of their average AUM) in March 2025 as against their gross payables of ₹1.26 lakh crore. SCBs (primarily PVBs) remained the major recipients of funds from AMC-MFs, followed by NBFCs, AIFIs and HFCs. More than half of the funding by the AMC-MFs continued to be in the form of equity holdings (Chart 2.44 a and b). d. Exposure of Insurance Companies 2.78 With gross receivables at ₹11.12 lakh crore against gross payables at ₹0.91 lakh crore, insurance companies were the second largest net providers of funds to the financial system as at end-March 2025. SCBs (primarily PVBs) were the largest recipients of their funds, followed by NBFCs and HFCs. Insurance companies provided funds mostly through LT debt and equity, accounting for 90 per cent of receivables, with limited exposure to ST instruments (Chart 2.45 a and b). e. Exposure to NBFCs (non-HFC) 2.79 NBFCs (non-HFCs) were the largest net borrowers of funds from the financial system, with gross payables at ₹21.15 lakh crore against gross receivables at ₹2.26 lakh crore as at end-March 2025. More than half of their funds continued to be sourced from SCBs, followed by insurance companies and AMC-MFs (Chart 2.46 a). 2.80 NBFCs (non-HFCs) garnered more than 70 per cent of funds through LT Loans and LT Debt, though the share of both continued to decline in H2:2024-25. The share of ST funding instruments (ST Loans and CPs) increased during the same period (Chart 2.46 b). f. Exposure to HFCs 2.81 HFCs, the third largest net borrowers, had gross payables at ₹6.00 lakh crore as against gross receivables of ₹0.14 lakh crore in March 2025. While SCBs continued to be the top fund providers, their share was seen to gradually decline with corresponding increase in funding from AMC-MFs. About 75 per cent of HFCs’ funds was sourced through LT loans and LT debt instruments (Chart 2.47 a and b).   g. Exposure of AIFIs 2.82 With gross payables and receivables at ₹9.06 lakh crore and ₹8.14 lakh crore, respectively, AIFIs were both active borrower and lender in the financial system and had net payable position of less than ₹1 lakh crore in March 2025. While the AIFIs raised funds mainly from SCBs, AMC-MFs and insurance companies, they were observed to lend to SCBs predominantly (83 per cent in March 2025) (Chart 2.48 a and b). II.7.2 Contagion Analysis 2.83 Contagion analysis uses network technology to estimate the systemic importance of different financial institutions. The failure of a bank due to solvency and / or liquidity losses could lead to contagion impact on the banking system along with the financial system depending upon the number, nature (whether it is a lender or a borrower) and magnitude of the interconnections that it has with the rest of the banking system.   a. Joint Solvency58- Liquidity59 Contagion Impact on SCBs due to Bank Failure 2.84 A contagion analysis of the banking network as at the end-March 2025 position indicated that the hypothetical failure of the bank with the maximum capacity to cause contagion losses would cause a solvency loss of 3.4 per cent of total Tier 1 capital of SCBs and liquidity loss of 0.3 per cent of total HQLA of the banking system (Table 2.13).  b. Solvency Contagion Impact on SCBs due to NBFC/ HFC Failure 2.85 As NBFCs (non-HFCs) and HFCs are among the largest borrowers of funds from the financial system, with a substantial part of funding from the banks, failure of any NBFC or HFC will act as a solvency shock to their lenders which can spread through contagion. 2.86 By end-March 2025, hypothetical failure of the NBFC with the maximum capacity to cause solvency losses to the banking system would have knocked off 2.9 per cent of the latter’s total Tier 1 capital but it would not lead to failure of any bank. Similarly, hypothetical failure of the HFC with the maximum capacity to cause solvency losses to the banking system would have knocked off 3.7 per cent of the latter’s total Tier 1 capital but without failure of any bank (Tables 2.14 and 2.15). 2.87 Further, in terms of the impact and vulnerability metrics developed for identification of impactful and vulnerable banks, two banks were common between the sets of top ten highly impactful banks and top ten highly vulnerable banks60 in March 2025. c. Solvency Contagion Impact after Macroeconomic Shocks to SCBs 2.88 Any contagion from failure of a bank is likely to get magnified if macroeconomic shocks result in distress to the banking system. In such a situation, similar shocks may cause some SCBs to fail the solvency criterion, which, then, acts as a trigger for further solvency losses. In the previous iteration, shock was applied to the entity that could cause the maximum solvency contagion losses. Here, we consider another iteration, where the initial impact on an individual bank’s capital is taken from the macro stress test61 results. The initial capital loss(+)/gain(-) stood at (-) 2.64 per cent, 13.83 per cent and 11.70 per cent of Tier I capital for baseline, adverse scenario 1 and adverse scenario 2, respectively. Further, all banks would be able to maintain Tier I capital ratio of 7 per cent under all three scenarios. It is observed that there would be no additional solvency losses to the banking system due to contagion (over and above the initial loss of capital due to the macro shocks). 1 Analyses are mainly based on data reported by banks through RBI’s supervisory returns covering only domestic operations of SCBs, except in the case of data on large borrowers, which are based on banks’ global operations. For this exercise, SCBs include public sector banks, private sector banks, foreign banks and small finance banks. 2 The analyses done in the chapter are based on the provisional data available as of June 10, 2025. 3 Private sector banks’ data for September 2023 quarter onwards are inclusive of merger of a large housing finance company with a private bank and, therefore, the data may not be comparable to past periods before the merger (applicable for all charts and tables). 4 Personal loans refer to loans given to individuals and consist of (a) consumer credit, (b) education loan, (c) loans given for creating/enhancement of immovable assets (e.g. housing, etc.) and (d) loans given for investment in financial assets (shares, debentures, etc.). 5 NNPA ratio is the proportion of net non-performing assets in net loans and advances. 6 PCR is the ratio of NPA provisions to GNPA. 7 Ratio of write-offs during the period to GNPA at the beginning of the period. 8 Write-offs include technical/prudential write-offs and compromise settlement, and may be subject to future recovery. 9 Stressed advances ratio is the ratio of total non-performing and standard restructured advances to total loans and advances. 10 A large borrower is defined as one who has aggregate fund-based and non-fund-based exposure of ₹5 crore and above to any single SCB. This analysis is based on SCBs’ global operations. 11 Special mention account (SMA) is defined as: 12 Tier I leverage ratio is the ratio of Tier I capital to total exposure. 13 Liquidity coverage ratio is defined as the ratio of stock of high-quality liquid assets (HQLA) to the total net cash outflow over the next 30 calendar days. 14 Net stable funding ratio is defined as the ratio of available net stable funding to required net stable funding. 15 Macro stress tests were conducted on a sample of 46 SCBs accounting for 98 per cent of the total assets of SCBs (excluding RRBs). 16 The shocks designed under adverse hypothetical scenarios are extreme but plausible. 17 VARX stands for Vector Autoregression with Exogenous Variables. See Annex-2 for detailed methodology. 18 Detailed methodology is provided in Annex 2. 19 Single factor sensitivity analyses are conducted for a sample of 46 SCBs accounting for 98 per cent of the total assets of SCBs (excluding RRBs). The shocks designed under various hypothetical scenarios are extreme but plausible. 20 The SD of the GNPA ratio is estimated by using quarterly data for the last 10 years. 21 In the case of default, the individual borrower in the standard category is considered to move to the sub-standard category. 22 In the case of default, the group borrower in the standard category is considered to move to the sub-standard category. 23 In case of failure, the borrower in sub-standard or restructured category is considered to move to the loss category. 24 The impact on the CRAR is estimated using additional provisioning needs and loss of interest income resulting from assets turning non-performing. 25 Chart 1 provides a visual explanation of CCRI calculation. 26 Chart 1 provides a visual explanation of reverse stress test using the curve. 27 Prior period consistency and comparability may be limited as historical data hasn’t been recast using the updated accounting standards. 28 The analysis in this portion is restricted to investments in India by the domestic operations of SCBs. Only interest rate related instruments for HTM, AFS and FVTPL (including HFT) portfolios and both interest and non-interest related investments for “Investment in Subsidiaries, Associates and Joint Ventures” are taken into account. 29 “Master Direction - Classification, Valuation and Operation of Investment Portfolio of Commercial Banks (Directions)” dated September 12, 2023. 30 PV01 is a measure of sensitivity of the absolute value of the portfolio to a one basis point change in the interest rate. 31 In terms of circular on “Guidelines on Banks’ Asset Liability Management Framework – Interest Rate Risk” dated November 04, 2010. 32 Gap refers to rate sensitive assets (RSA) minus rate sensitive liabilities (RSL). Advances, investments, swaps/ forex swaps and reverse repos are major contributors to RSA whereas deposits, swaps/ forex swaps and repos are observed to be the main elements under RSL. 33 The DGA involves bucketing of all RSA and RSL as per residual maturity/ re-pricing dates in various time bands and computing the Modified Duration Gap (MDG). 34 RBI circular no. RBI/2013-14/635 DBOD.BP.BC.No.120/21.04.098/2013-14 dated June 09, 2014, on “Basel III Framework on Liquidity Standards – Liquidity Coverage Ratio (LCR), Liquidity Risk Monitoring Tools and LCR Disclosure Standards”. 35 The stress scenarios are described in Annex 2. 36 Percentage of the total credit and deposit of SCBs (excluding RRBs) as of March 31, 2025. 37 Stress tests on derivatives portfolio are conducted by a sample of 36 banks (10 more banks have been included in the sample in this FSR to enhance the coverage considering that these banks had Rs 1,000 crore or more ‘Total Derivative Exposure’ on a continuous basis over the quarters), constituting active authorised dealers and interest rate swap counterparties. Details of test scenarios are given in Annex 2. 38 Stress tests are conducted by a sample of 37 banks (10 more banks have been included in the sample in this FSR to enhance the coverage). 40 Data are provisional and based on submission by UCBs through RBI supervisory returns. 41 Based on common sample of 1,294 UCBs covering over 90 per cent of gross loans extended by all UCBs. 42 Revised Regulatory Framework for Urban Co-operative Banks (UCBs) – Net Worth and Capital Adequacy (circular DOR.CAP.REC.No.86/09.18.201/2022- 23 dated December 01, 2022 and DOR.CAP.REC. No.109/09.18.201/2022-23 dated March 28, 2023). 43 The stress test is conducted with reference to the financial position of March 2025 for select 213 UCBs with asset size of more than ₹500 crore, excluding banks under the Reserve Bank’s All Inclusive Directions (AID). These 213 UCBs together cover around 72 per cent of the total assets of the UCB sector. The detailed methodology used for stress test is given in Annex 2. 44 The regulatory minimum CRAR for Tier 1 UCBs is 9 per cent and for the UCBs in Tier 2, Tier 3 and Tier 4 is 11 per cent. Further, UCBs in Tier 2, Tier 3 and Tier 4 shall achieve the CRAR of at least 12 per cent by March 31, 2026. 45 The analyses done in this section are based on the provisional data available for NBFCs in Upper Layer and Middle Layer excluding CICs, HFCs and SPDs, but includes companies presently under resolution as of June 10, 2025. Prior period consistency and comparability may be limited as NBFC data has been reclassified based on scale-based regulation. The effect of mergers and reclassifications, if any, has not been considered for recasting historical data. 46 The detailed methodology used for stress tests of NBFCs is provided in Annex 2. 47 The sample comprised of 158 NBFCs in the Upper Layer and Middle Layer with total advances of ₹26.94 lakh crore as of March 2025, which form around 95 per cent of total advances of non-Government NBFCs. The sample for stress test excluded Government NBFCs, companies presently under resolution, stand-alone primary dealers and investment focused companies. 48 The detailed methodology used for stress tests of NBFCs is provided in Annex 2. 49 Stress testing based on liquidity risk was performed on a sample of 244 NBFCs in the Upper Layer and the Middle Layer. The total asset size of the sample was ₹36.01 lakh crore, comprising around 99 per cent of total assets of non-government, non-CIC NBFCs in the sector. 50 The methodology used for stress testing at clearing corporations is given in Annex 2. 51 As per SEBI Circular on “Review of Stress Testing Framework for Equity Derivatives Segment for Determining the Corpus of Core Settlement Guarantee Fund (Core SGF)” dated October 01, 2024, SEBI introduced additional stress testing scenarios / methodologies for determining the Minimum Required Corpus (MRC) of Core SGF in the equity derivatives segment. The increase in values of MRC and Average Stress Test Losses observed from October 2024 in the Equity Derivatives Segments is due to such additional stress testing scenarios / methodologies. SEBI, vide letter dated May 03, 2024, had advised Clearing Corporation 1 to augment its Core-SGF in equity derivatives segment to at least ₹10,500 crore within six months. This was done after the study conducted by Clearing Corporation 1 which projected that its stress test losses could significantly rise over next three years. 52 The network model used in the analysis has been developed by Professor Sheri Markose (University of Essex) and Dr. Simone Giansante (Bath University) in collaboration with the Financial Stability Department, RBI. 53 The analyses are based on data of 229 entities from the following eight categories: SCBs, scheduled UCBs (SUCBs), AMC-MFs, NBFCs, HFCs, insurance companies, pension funds and AIFIs. Number of entities included are 88 SCBs, 20 SUCBs; 25 AMC-MFs (which cover more than 98 per cent of the AUMs of the mutual fund sector); 42 NBFCs (both deposit taking and non-deposit taking systemically important companies, which represent about 70 per cent of total NBFC assets); 22 insurance companies (which cover more than 95 per cent of assets of the sector); 17 HFCs (which cover more than 80 per cent of total HFC assets); 10 PFs and 5 AIFIs (NABARD, EXIM Bank, NHB, SIDBI and NaBFID). 54 Includes exposures between entities of the same group as well as different groups. Exposures are outstanding position as on March 31, 2025 and are broadly divided into fund-based and non-fund-based exposure. Fund-based exposure includes money market instruments, deposits, loans and advances, long-term debt instruments and equity investments. Non-fund-based exposure includes letter of credit, bank guarantee and derivative instruments (excluding settlement guaranteed by CCIL). 55 Inter-sectoral exposures do not include transactions among entities of the same sector in the financial system. 56 The diagrammatic representation of the network of the banking system is that of a tiered structure, in which different banks have different degrees or levels of connectivity with others in the network. The most connected banks are in the inner-most core (at the centre of the network diagram). Banks are then placed in the mid-core, outer core and the periphery (concentric circles around the centre in the diagram), based on their level of relative connectivity. The colour coding of the links in the tiered network diagram represents borrowings from different tiers in the network (for example, the green links represent borrowings from the banks in the inner core). Each ball represents a bank and they are weighted according to their net positions vis-à-vis all other banks in the system. The lines linking each bank are weighted on the basis of outstanding exposures. 57 88 SCBs and 20 SUCBs were considered for this analysis. 58 In solvency contagion analysis, gross loss to the banking system owing to a domino effect of hypothetical failure of one or more borrower banks is ascertained. Failure criterion for contagion analysis has been taken as Tier 1 capital falling below 7.5 per cent for SFBs, while 7 per cent for other banks. 59 In liquidity contagion analysis, a bank is considered to have failed when its liquid assets are not enough to tide over a liquidity stress caused by the hypothetical failure of a large net lender. Liquid assets are measured as: 18 per cent of NDTL + excess SLR + excess CRR. 60 The detailed methodology is given in Annex 2. 61 The contagion analysis used the results of the macro-stress tests and made the following assumptions: |
")


Install the RBI mobile application and get quick access to the latest news!


