Chapter I: Macrofinancial Risks - RBI - Reserve Bank of India


Chapter I: Macrofinancial Risks
|
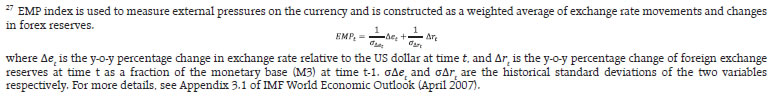
An uncertain and volatile global macroeconomic environment is testing the resilience of the global financial system. Global financial stability risks have increased as heightened policy and trade uncertainties have the potential to interact with existing vulnerabilities, especially elevated public debt, and amplify adverse shocks. The Indian economy and the financial system, however, continue to exhibit resilience, aided by strong macroeconomic fundamentals and a robust financial system. Risks emanating from global spillovers and escalation in geopolitical tensions and policy uncertainties remain a key concern. Introduction 1.1 Since the December 2024 Financial Stability Report (FSR), near-term global financial stability risks have risen significantly, driven by heightened geopolitical tensions and economic and trade policy uncertainties (Chart 1.1 a and b). Shifting US trade policies and lack of clarity surrounding its economic policies triggered a spike in volatility and sharp price declines across a range of markets. Consequently, financial conditions have tightened, and growth prospects have weakened. Though markets have recovered from the early-April lows due to sharp tariff hikes, considerable uncertainty persists about the evolution of trade patterns and economic outlook. Moreover, despite the recent market turmoil, asset valuations in several markets stay high relative to fundamentals and risks remain concentrated with exposures to a few large technology firms. Overall, global financial stability risks remain elevated, as unprecedented trade and policy uncertainties and unpredictability could potentially interact with the existing vulnerabilities - rising public debt, high leverage in the non-banking financial intermediaries (NBFIs) sector and stretched asset valuations - to amplify adverse shocks.  1.2 Amidst elevated global economic and trade policy uncertainties, the Indian economy continues to display resilience, underpinned by strong macroeconomic fundamentals and robust financial system. The economy is growing at a healthy pace, with the financial system meeting the financing needs of all sectors of the real economy. At the same time, domestic financial stability risks remain contained, as reflected in improving asset quality, strong capital and liquidity buffers and robust profitability of banks and non-bank lenders. The volatility in domestic financial markets also remained relatively low. 1.3 The domestic financial system, however, could be impacted by external spillovers. Growing trade disruptions and intensifying geopolitical hostilities could negatively impact domestic growth outlook and reduce the demand for bank credit, which has decelerated sharply. Moreover, it could also lead to increased risk aversion among investors and further corrections in domestic equity markets, which despite the recent correction, remain at the high end of their historical range. 1.4 Overall, while the broader financial system remains resilient, there is some build-up of stress primarily in financial markets on account of global spillovers. This is reflected in the marginal rise in the financial system stress indicator (FSSI), an indicator of the stress level in the Indian financial system, compared to its position in H1:2024-25 (Chart 1.2). 1.5 Against this backdrop, this chapter is structured into six sections. Section I.1 discusses evolving international and domestic macroeconomic developments and their implications for the near-term economic outlook. Section I.2 analyses the key trends and financial conditions across equity, bond and forex markets, while Section I.3 provides an assessment of corporate and household sector vulnerabilities. Sections I.4 and I.5 examine the stability of the banking and non-bank financial sectors, respectively. Section I.6 summarises the findings of the latest round of the systemic risk survey (SRS).  I.1.1 Global Outlook 1.6 The global macroeconomic outlook has deteriorated markedly amidst headwinds from persistent trade frictions, heightened policy uncertainty, and weak consumer sentiment. Despite some easing in tariff tensions on prospects of trade deals, the economic outlook remains fragile amidst elevated trade uncertainty. This could adversely impact consumer spending, business investment and financial conditions. The estimates of effective tariff rate on US merchandise imports have reached their highest level since 19381. The impact of such tariff measures, however, may vary across countries as tariffs constitute an adverse supply shock for the implementing countries and a negative demand shock for their trading partners2.  1.7 The global economy and the financial system have demonstrated exceptional resilience in the face of multiple shocks in recent years. However, the imposition of higher tariffs by the US has introduced a fresh shock to the global economy. The global output is, therefore, expected to remain below the historical average and inflation is projected to be above the long-term average in 2025 (Chart 1.3 a and b). Consequently, overall growth-inflation dynamics remain less than favourable relative to their long-run trends. 1.8 Citing escalation in trade tensions and elevated policy uncertainty, the International Monetary Fund (IMF) in its April 2025 World Economic Outlook has revised global growth projection downwards to 2.8 per cent in 2025 and 3.0 per cent in 20263 (Chart 1.4 a). Growth in both advanced economies (AEs) and emerging market and developing economies (EMDEs) is projected to decelerate. Consensus private sector forecasts, however, indicate a sharper deceleration in output growth (Chart 1.4 b). Furthermore, the IMF’s Growth-at-Risk (GaR) model, an important metric to assess risks to growth under extreme scenarios, indicates that there is a five per cent chance that global growth could fall below 0.4 per cent in the next one year4.  1.9 Other multilateral agencies have also lowered their global growth forecasts. The Organisation for Economic Co-operation and Development (OECD), in its Economic Outlook released in June 2025, has revised the global GDP growth forecast for 2025 by 20 basis points (bps) relative to its assessment in March 2025 report to 2.9 per cent. Similarly, the World Bank, in its June 2025 Global Economic Prospects (GEP), projected global GDP growth (using PPP weights) to decelerate from 3.3 per cent in 2024 to 2.9 per cent in 2025, lower by 30 bps relative to January 2025 projections. Moreover, the persistence of elevated trade frictions is expected to lower trade volumes going forward5, with the deceleration disproportionately concentrated in the US, China, and their closely linked regional trading partners. 1.10 Disinflation momentum has stalled, especially in AEs, where inflation generally remains above the central bank targets. Inflation in emerging market economies (EMEs), on the other hand, is mostly ruling below the targets (Chart 1.5 a). A slower retreat in services inflation, an uptick in core goods inflation and uncertainty around the impact of tariffs pose upside risks to global inflation. Nonetheless, the progress in disinflation so far has enabled central banks to pivot to monetary policy easing cycle in most jurisdictions (Chart 1.5 b). The US, however, remains an important exception, as it has held its policy rate constant in 2025 so far and markets expect fewer rate cuts this year. Overall, monetary authorities are charting out divergent policy trajectory, as they confront different trade-offs between growth and inflation.  1.11 Rising global public debt has been a recurring issue highlighted in recent FSRs and it remains a key concern, especially in the context of elevated uncertainty, slowing growth, rising debt servicing costs and growing spending pressures. According to the IMF, global public debt as a percentage of GDP is projected to reach above 95 per cent this year and 100 per cent by the end of the decade (Chart 1.6), while it may reach 117 per cent by 2027 in a severely adverse scenario6. In addition, the public debt in about one-third of the countries, which makes up 80 per cent of the global GDP, is currently larger than the pre-pandemic levels, driving the increase in global public debt7. Furthermore, countries with high levels of debt are also running large primary deficits (Chart 1.7). 1.12 Alongside the increase in debt levels, interest expenses as a share of government revenue remain elevated for most major AEs and EMEs (Chart 1.8 a and b). With debt levels projected to increase further as countries issue more debt to support economic activity, debt sustainability in those countries will be adversely impacted. The interest rate-growth rate differential is becoming increasingly adverse for debt sustainability in both the US and Europe (Chart 1.9). The rating agency Moody’s decision to downgrade the sovereign rating of the US citing sharp increase in debt, widening fiscal deficit and rising interest payments reflects this growing risk.    1.13 In this context, the smooth functioning of the sovereign bond markets, which must absorb larger bond issuances, is vital for financial stability. Sovereign bond markets are increasingly dominated by leveraged price-sensitive private investors even as constraints on banks to act as market makers and liquidity providers have tightened10. Thus, in times of stress, the resilience of market functioning will be tested (See paragraphs 1.23 to 1.25 for details). I.1.2 Domestic Outlook 1.14 The Indian economy, supported by strong macroeconomic fundamentals, remained the fastest growing major economy in the world during 2024-25. Moreover, as India’s growth is largely dependent on domestic demand, the impact of external shocks remained limited. In terms of growth outturns11 for 2024, India’s actual growth rate did not deviate significantly from projections even amidst deteriorating global outlook (Chart 1.10 a). The RBI has projected the real GDP to grow at 6.5 per cent in 2025-2612, same as in 2024-25, supported by buoyant rural demand, revival in urban demand, an uptick in investment activity on the back of above-average capacity utilisation, government’s continued thrust on capex and congenial financial conditions (Chart 1.10 b). The continued momentum in various high frequency indicators of services sector, robust agricultural production and above normal southwest monsoon forecasts, and strong goods and services tax (GST) collections underscore the sustained momentum and resilience of the economy.  –") 1.15 The headwinds from protracted geopolitical tensions, elevated uncertainty and trade disruptions, and weather-related uncertainty pose downside risks to growth. Moreover, deceleration in global growth will act as a drag on domestic output. It is estimated that a 100 basis points (bps) slowdown in global growth can, ceteris paribus, pull down India’s growth by 30 bps13. 1.16 Domestic inflation has been steadily declining with the headline consumer price index (CPI) inflation recording a six-year low of 2.8 per cent in May 2025 (Chart 1.11). The outlook for food inflation remains favourable on account of softening prices and robust crop production. Moreover, the risk of imported inflation largely remains low with the anticipated slowdown in global growth likely to soften commodity and crude oil prices, although the recent escalation of geopolitical tensions in the Middle East has led to heightened uncertainty. The near-term and medium-term outlook gives greater confidence of a durable alignment of headline inflation with the target of 4 per cent, and it is likely to undershoot the target at the margin as per the projections of the RBI.   1.17 On the fiscal front, India’s public debt levels, primary deficit and share of interest payment in government revenue have remained relatively on the higher side compared to peer EMEs (Chart 1.12 a, b and c). However, India’s fiscal position and credibility has enhanced significantly in recent years on account of ongoing fiscal consolidation, improvement in the quality of expenditure and earmarking of debt-to-GDP as the nominal anchor for the central government’s fiscal policy. In addition, the government debt is predominantly rupee-denominated. The weighted average maturity of outstanding stock of central government market borrowings has risen from 10.4 years in 2018-19 to 13.2 years in 2024-2514 and around 97 per cent are issued at fixed rate15. Furthermore, unlike most other major economies, the flow data points to a lower debt trajectory supported by strong nominal GDP growth (Chart 1.13 a). Alongside, the favourable interest rate-growth rate differential of the central government augurs well for debt sustainability (Chart 1.13 b). 1.18 The resilience of the external sector has been a key contributing factor to India’s macroeconomic and financial stability. Current account deficit (CAD) at 0.6 per cent of GDP during 2024-25 remains eminently manageable, supported by sustained buoyancy in services exports and remittances. Moreover, current account balance turned into a surplus of 1.3 per cent of GDP in Q4:2024-25 (Chart 1.14).   1.19 In the capital account, high gross foreign direct investment (FDI) during 2024-25 indicates that India continues to remain an attractive investment destination. Net FDI flows, however, moderated due to higher repatriation and net outward FDI. Foreign portfolio investments (FPI) moderated during 2024-25. On the other hand, both external commercial borrowings (ECB) and non-resident deposits recorded higher inflows compared to the previous financial year (Table 1.1). Overall, net capital flows fell short of CAD during 2024-25, leading to a depletion in foreign exchange reserves. An update of the capital flows at risk framework16, which estimates the entire distribution of capital flows, shows that under extreme adverse shocks, with five per cent probability, the expected FPI outflows could reach 6 per cent of the GDP, while total capital outflows, that is, FPI and FDI, could be in the magnitude of about 7 per cent of GDP.  1.20 Notwithstanding the uncertainty surrounding the trade outlook, India’s external vulnerability indicators remain robust and continue to show improvement. Foreign exchange reserves at US$ 697.9 billion, as on June 20, 2025, are sufficient to cover more than 11 months of merchandise imports on BoP basis; external debt stood at a moderate 19.1 per cent of GDP at end-March 2025; the share of short-term debt on residual maturity basis stood at 45.4 per cent of foreign exchange reserves at end-March 2025; and net international investment position (IIP) improved (Chart 1.15 a and b). I.2.1 Global Financial Markets 1.21 The unsettling of the global trade outlook following the announcement of tariffs by the US in April 2025 created significant turbulence in global financial markets, as concerns about uncertain economic outlook and corporate profitability led to large sell off across multiple markets. Unlike previous risk-off episodes, traditional safe-haven assets such as the US treasuries fell, and the US dollar (USD) weakened. Equity markets, especially in the US, that have outperformed most global peers in the last five years, saw a sharp sell-off after the reciprocal tariff announcement in early April along with other AEs and EMEs (Chart 1.16 a). Global equity markets have since recovered on de-escalation in trade tensions. Long-term government bond yields rose after initially declining in a flight to safety, reflecting investors’ preference for cash and shorter-duration assets amid deteriorating fiscal outlook, especially in the US (Chart 1.16 b). Other segments of the financial markets were also affected by the turmoil as corporate bond spreads widened, prices of oil and copper fell, the market value of crypto assets declined, and open-ended investment funds and exchange-traded funds saw substantial outflows. This led to a tightening of financial conditions and significant bouts of volatility in financial markets, which has somewhat eased on the prospects of trade deals (Chart 1.16 c and d).  1.22 The April 2025 market turmoil brought into focus a few key market vulnerabilities. First, valuations of US stocks, which form nearly 55 per cent of global equity market17, remain stretched by historical standards. The forward price-to-earnings (P/E) ratio – the ratio of equity prices to expected 12-month earnings – is well above the historical median (Chart 1.17 a), and equity risk premium – a measure of additional return investors require to buy stocks relative to risk-free bonds – has declined to decadal low levels (Chart 1.17 b). Moreover, to justify current valuations, corporate earnings must grow at a robust pace, which may be difficult in an uncertain economic environment (Chart 1.17 c). Further price corrections and elevated volatility in US equities could spill over to other markets, especially EMEs like India.   1.23 Second, the core government bond markets, which are integral to the efficient functioning of global capital markets and the financial system, are exhibiting vulnerabilities driven by deterioration in market liquidity (Chart 1.18 a), increasing footprint of highly leveraged and price-sensitive NBFIs, and elevated volatility amid high levels of global public debt. In particular, the market liquidity in the US$ 29 trillion US treasury market, the largest and the most liquid bond market in the world, has been falling and dropped further in April 202518. Insufficient liquidity has the potential to amplify asset price volatility and cause significant price movements in reaction to shocks. This is also reflected in the widening bid-ask spreads as well as substantial daily change in bond yields (Chart 1.18 b and c). Alongside, the risk warehousing capacity of broker-dealers, firms that engage in the business of buying and selling securities either on their own behalf or on behalf of their clients, has decreased in recent times when compared with the size of trade flows, even as other non-bank liquidity providers appear to retract from filling up this gap in times of stress episodes19.  1.24 In recent years, hedge funds and other asset managers have taken on highly leveraged relative-value trades in US treasuries, such as basis trades and asset swap trades. These trades aim to take advantage of small differences in prices between the underlying cash market and derivatives market and involve in arbitraging the spread between treasury bonds and futures and treasury yields and interest rate swaps. The repo market is used for funding these trades and since price differences are small, they employ high leverage to improve returns. Due to their high leverage and exposure to spike in both futures margins and repo borrowing costs, these trades are a source of financial system vulnerability20. 1.25 Basis trades have almost doubled since March 2020 and swaps trades have incurred losses as spreads have not converged to zero (Chart 1.19 a and b). Moreover, these trades remain concentrated among a handful of hedge funds21. Concurrently, asset managers, such as mutual funds are also tapping treasury futures to enhance interest rate exposures, incentivised by the embedded leverage and high liquidity of futures contracts22. Increase in volatility in response to future shocks or shifts in risk sentiments can lead to disorderly unwinding of these trades, impacting smooth functioning of global bond markets. Moreover, risks can also spillover to the banking sector as hedge funds rely on banks, particularly globally systemically important banks (GSIBs), for more than 50 per cent of their total funding23 (Chart 1.19 c). 1.26 USD faced sharp depreciation pressure against most major currencies in the recent market turmoil (Chart 1.20 a and b). Typically, the USD tends to outperform other currencies in two entirely different scenarios; during periods of global stress as well as when the US economy exhibits exceptional growth, on the other hand it underperforms when global growth is strong relative to the US – the so-called ‘dollar smile’. This has been the defining framework for forex investors for a considerable period. However, in the current episode of exceptional economic uncertainty, the prices of US financial assets, including equities, have fallen forcing global investors to rebalance their portfolio. This has contributed to the depreciation of the USD, as growth slowdown fears and fiscal worries continue to weigh on the dollar.   Importantly, the correlation between the USD and the US treasury bond yields has diverged since the tariff announcements in April (Chart 1.20 c). In parallel, investors are increasingly hedging their holdings in dollar-denominated assets24, which could put further pressure on the USD. Moreover, there are structural changes happening in the global economy such as a major shift in the US trade policy and resetting of the global economic order. Thus, we could be entering uncharted territory in the global financial system as the USD’s primacy and safe-haven status are being challenged. I.2.2 Domestic Financial Markets 1.27 Domestic financial conditions tightened during January-March 2025, driven by widening of money and corporate bond market spreads (Chart 1.21 a). Since April 2025, financial conditions have eased supported by the Reserve Bank’s liquidity infusion measures and policy rate cuts. The Reserve Bank has injected durable liquidity amounting to about ₹9.5 lakh crore through suite of liquidity measures (open market operation purchases, buy-sell swaps and term variable rate repos) since January 2025, which led to system liquidity transitioning from deficit to surplus at end-March 2025. Additionally, the decision to cut cash reserve ratio (CRR) by 100 bps in a staggered phase will release ₹2.5 lakh crore of primary liquidity starting September till December 2025. Cumulatively, these measures have not only turned durable liquidity into surplus but will also contribute to faster transmission of monetary policy to the financial and credit markets (Chart 1.21 b and c).  1.28 Money market spreads have eased from the highs seen during January-March 2025, remaining near their long-term averages (Chart 1.22 a). Certificate of deposit (CD) spreads widened in the initial part of 2025 due to the tightness in system liquidity and large issuances of CDs by banks to bridge asset-liability mismatches (Chart 1.22 b). However, the easing of monetary policy and infusion of durable liquidity in recent months have narrowed the money market spreads. Notably, the spread between CDs and overnight indexed swaps (OIS) of similar maturity, a key metric of money market stress, has retreated from recent high. Similarly, the spread between commercial papers (CPs) issued by non-banking financial companies (NBFCs) and treasury bills of the same maturity also narrowed, reflecting surplus liquidity conditions.  1.29 The sovereign yield curve has bull steepened25, driven by faster disinflation and monetary policy easing (Chart 1.23 a). Consequently, term spreads rose (between 10-year and 2-year government bonds) to an average of about 24 bps during January – June 2025 (till June 10, 2025) from 9 bps during July-December 2024. The rise in US treasury yields along with the fall in India government bond yields has narrowed the spread between India and US 10-year treasury yields to a 20-year low (Chart 1.23 b). The bid-ask spreads on government bonds have softened, especially among semi-liquid and illiquid securities26, signaling improved trading conditions in the sovereign bond market (Chart 1.23 c).  1.30 The foreign exchange market witnessed bouts of volatility even as the USD/INR exchange rate recorded sharp two-way movements during January-May 2025. The pace of rupee depreciation accelerated in late 2024 and continued till February 2025. In March and April, however, it appreciated supported by the broad-based weakness of the USD and relatively better economic outlook for India vis-à-vis other economies (Chart 1.24). Different indicators, such as the real effective exchange rate (REER), the exchange market pressure (EMP) index27, implied volatility derived from option prices, and offshore-onshore spreads, continue to underscore the stability of the exchange rate (Chart 1.25 a, b, c and d). 1.31 Resource mobilisation through capital markets grew by 32.9 per cent to ₹15.7 lakh crore in 2024-25. Debt markets had the dominant share (63.5 per cent) in resource mobilisation, of which 99.2 per cent was raised through listed private placements (Table 1.2). Equity markets accounted for 27.4 per cent of total resource mobilisation. 1.32 The Indian equity market, which saw deep corrections between October 2024 and February 2025, owing to tepid earnings growth, FPI outflows and global sell-off, has largely recovered since March 2025. Nonetheless, as on June 10, 2025, most of the benchmark indices traded 3 to 8 per cent lower compared to their 52-week highs with the overall total market capitalisation down by 7 per cent from its peak in 2024 (Chart 1.26 a). Consequently, Indian equity market remained an underperformer compared to other major markets (Chart 1.26 b). Notably, despite the sharp decline in stocks, volatility remained relatively subdued until the recent spike triggered by geopolitical tensions and tariff-induced uncertainty (Chart 1.26 c). Furthermore, India’s weightage in the MSCI Emerging Markets (EM) Index has remained steady at 18.5 per cent as at end-March 2025 (Chart 1.26 d).   1.33 Amidst a global rebalancing of funds from EMEs’ equities28 to fixed income and developed markets29, Indian equity market, like other EMEs, saw consistent FPI outflows since October 2024 (Chart 1.27 a and b). Consequently, the foreign portfolio investors’ share in Indian equities has touched a decadal low, with domestic institutional investors’ (DIIs) share in overall ownership in all NSE-listed companies surpassing that of foreign portfolio investors (Chart 1.27 c and d).   ") 1.34 During periods of heightened volatility, risk-off sentiments and sustained selling of Indian equities by the foreign portfolio investors, DIIs and individual investors (domestic households) have been providing strong support, thereby preserving market stability. 1.35 Equity valuations have moderated from their lofty levels, though they remain at the high end of historical range, especially for the midcap and smallcap stocks (Chart 1.28 a). Consequently, the gap between estimated earnings growth and required earnings growth for returning to historical valuation multiple has also reduced (Chart 1.28 b). Nonetheless, since earnings forecast updates more slowly than market prices and they are yet to reflect the prevailing geopolitical tensions and elevated uncertainty about the direction of tariffs, the current valuations may not be reflecting the extent of overvaluation (Chart 1.28 c). Moreover, the contribution of equity risk premium to returns remains high for midcap stocks (Chart 1.28 d). Thus, between earnings revisions and valuation compression, market impact could be significant in the event of adverse shocks. 1.36 Overall, as at end-March 2025, about two-thirds of stocks were trading with their P/E ratios higher than their respective benchmark P/E ratios (Chart 1.29). 1.37 The individual participation in Indian equities has increased in the last decade and the ownership pattern shows that their investments are diversified. However, their ownership share in microcap stocks far outweigh those in large, mid and smallcap stocks (Chart 1.30 a, b and c). Microcap stocks have a higher beta compared to other stocks and exhibit greater sensitivity to change in economic and financial conditions. Thus, market corrections could expose retail investors to greater volatility and amplify losses.   1.38 The growing participation of individual investors and associated risks in the equity derivatives segment were highlighted in June 2024 FSR. Since then, the SEBI has taken several important measures to strengthen this market segment, including but not limited to, rationalisation of weekly index derivatives products, increase in tail risk coverage on the day of options expiry, ensuring expiry of all index derivatives products on single day of the week, increase in contract sizes, upfront collection of option premium from buyers, removal of calendar spread treatment on the expiry day and intraday monitoring of position limits. Consequently, between December 2024 and March 2025, the average daily traded value by individuals and number of individuals trading per month declined by 14.4 per cent and 12.4 per cent, respectively, compared to an increase of 47.6 per cent and 101.8 per cent, respectively, between December 2023 and March 2024.  1.39 Geopolitical risk events often impact financial market variables. India’s equity market performance during global geopolitical episodes generally mirrors that of EMDEs compared to AEs. However, the interquartile range is relatively wider than EMDEs, indicating that stock returns exhibit more variability (Chart 1.31 a). Exchange rate movements, on the other hand, were smaller and more stable with a narrow interquartile range (Chart 1.31 b). The event study analysis of several past events corroborates the limited impact of such episodes on financial markets in India (Box 1.1).  1.40 In the debt market, corporate bond net outstanding rose to ₹53.6 lakh crore as at end-March 2025 with the highest ever fresh issuance of ₹9.9 lakh crore during 2024-25. Secondary market, however, remained lacklustre with average monthly turnover at 3.8 per cent of outstanding value (Chart 1.32 a). Listed private placements overwhelmingly remained the preferred route for resource mobilisation, while public issuances formed only a small fraction of total issuances (Chart 1.32 b). In 2024-25, AAA-rated firms dominated issuances with firms rated below AA constituting 16.0 per cent of the total issuances (Chart 1.32 c). Corporate bond spreads widened marginally due to tighter liquidity conditions, trade related uncertainty and softer growth prospects. Median spreads across rating categories were higher by 20-30 bps, even though yields softened (Chart 1.32 d). From a financial stability perspective, a deep and liquid corporate debt market is important as it provides an alternative to bank finance, widens investor base and improves overall resilience of the financial system.
 1.41 The development of a robust repo market enhances liquidity and efficiency in the corporate bond market. Accordingly, the AMC Repo Clearing Limited (ARCL) was operationalised in July 2023 as a Limited Purpose Clearing Corporation (LPCC) for providing clearing and settlement services as well as settlement guarantee for tri-party repo in corporate debt securities. The monthly trading volumes in this platform has seen robust growth (Chart 1.33). The ARCL platform also allows parties to offset their obligations through netting, and it provides a valuable tool for reducing risk, streamlining transactions and improving market efficiency. 1.42 Cyber security risk is a key vulnerability in securities markets. The expanding scale of digital financial services, cloud-based infrastructure and interconnected systems across sectors has exponentially increased the cyberattack surface. Given the systemic interconnectedness of financial entities and technology service providers, ensuring cyber resilience is critical to maintaining trust, stability and business continuity. As organisations increasingly depend on third party service providers for their business operations, vulnerabilities in the supply chain could pose systemic risk. Furthermore, the overreliance on a few major IT and cloud service providers has created dependency and vendor lock-in problems leading to concentration risks. Vulnerability in one system can quickly propagate across networks, affecting multiple entities. Phishing and social engineering attacks are evolving through Generative AI-powered methods, such as deepfakes and contextual frauds. Poorly secured Application Programming Interfaces (APIs), misconfigured databases, weak access controls and insider threats contribute to frequent data leaks and breaches, threatening both customer trust and regulatory compliance.  1.43 In this context, cybersecurity resilience will depend on the Security Operations Center (SOC) efficacy, risk-based supervision, zero-trust approaches and AI-aware defense strategies. Graded monitoring mechanisms, the use of behavioral analytics for threat detection, hands-on training, continuous learning and simulation-based exercises such as through Continuous Assessment-Based Red Teaming (CART), scenario-based resilience drills and uniform incident reporting frameworks are vital for enhancing the resilience of the digital ecosystem. Alongside, to ensure effective governance and preparedness, organisations must adopt measurable benchmarks like Cyber Capability Index and SOC Efficacy. I.3 Corporate and Household Sector I.3.1 Corporate Sector 1.44 Indian corporate sector remained resilient even as firms are navigating heightened trade policy uncertainty. Despite the moderation in sales growth of listed private non-financial corporates (NFCs), their operating profit margin remained solid (Chart 1.34 a and b). 1.45 Listed private NFCs’ debt serviceability improved as reflected in the healthy interest-coverage ratio32 (ICR) of firms across the manufacturing, services and information technology sectors (Chart 1.35). Furthermore, NFCs’ debt-service ratio33 remained one percentage point below historical average even as weighted average lending rate has risen by 162 bps since March 2022 to December 2024 (Chart 1.36 a). Moreover, their cash buffers34 remain sizeable (Chart 1.36 b).    1.46 At a broader level, vulnerabilities in the corporate sector remain contained with the debt-to-equity ratios of listed private NFCs consistently declining (Chart 1.37 a). When compared globally, India’s corporate debt-to-GDP ratio has been low compared to AE and EME peers (Chart 1.37 b). Moreover, the risk from unhedged ECBs has reduced with their share falling to 26.1 per cent in March 2025 compared to 32.9 per cent in September 202435. The trade policy uncertainty, however, is likely to impact earnings estimates, which have already been moderating in the recent past. The higher effective tariff rates are likely to put pressure on corporate margins going forward (Chart 1.37 c).  I.3.2 Household Sector 1.47 India’s household debt has been increasing in recent years, driven by rising borrowing from the financial sector. However, as on end-December 2024, India’s household debt at 41.9 per cent of GDP (at current market prices) was relatively low compared to other EMEs (Chart 1.38). 1.48 Among broad categories of household debt, non-housing retail loans, which are mostly used for consumption purposes36, formed 54.9 per cent of total household debt37 as of March 2025 and 25.7 per cent of disposable income as of March 2024 (Chart 1.39 a and b). Moreover, the share of these loans has been growing consistently over the years, and their growth has outpaced that of both housing loans and agriculture and business loans (Chart 1.39 c).  1.49 Housing loans, on the other hand, formed 29.0 per cent of household debt and their growth has been steady. However, disaggregated data shows that incremental growth has been mainly driven by the existing borrowers who are availing additional loans, and their share has increased to more than a third of the housing loans sanctioned in March 2025 (Chart 1.40 a). Moreover, share of borrower accounts with loan-to-value (LTV) ratios greater than 70 per cent is also rising (Chart 1.40 b), and delinquency levels are higher for lower-rated and more leveraged borrowers. However, these have declined considerably from their levels during COVID-19 (Chart 1.40 c). ") ")   1.50 At an aggregate level, the per capita debt of individual borrowers38 has grown from ₹3.9 lakh in March 2023 to ₹4.8 lakh in March 2025 (Chart 1.41 a). The rise in per capita debt has been mainly led by the higher-rated borrowers (Chart 1.41 b). 1.51 The share of better-rated customers (prime and above) among total borrowers is growing, both in terms of the outstanding amount and number of borrowers (Chart 1.42 a and b). This is important from a debt serviceability and financial stability perspective, as it indicates that household balance sheets at an aggregate level are resilient. 1.52 An update of the analysis of financial wealth of Indian households40 shows that the financial wealth of households grew sharply in 2023-24 (Chart 1.43 a). Since Q3:2019-20, asset price gains contributed to around one-third of the increase in the financial assets, while the remaining was on account of an increase in financial savings (Chart 1.43 b). Deposits and insurance and pension funds formed nearly 70 per cent of household financial wealth as at end-March 2024 even as the share of equities and investment funds has increased (Chart 1.43 c).  1.53 Overall, the risks to the Indian financial system from lending to households remain contained with easing monetary policy cycle likely to reduce debt service pressures on borrowers going forward. However, the trend in household debt accumulation, especially among lower-rated borrowers, requires close monitoring.  I.4 Banking System41 1.54 The resilience of the banking system has been pivotal to the strength of the Indian financial system. This is evident in scheduled commercial banks’ (SCBs) strong capital and liquidity buffers, improved asset quality and robust earnings (Chart 1.44). Adequate high quality common equity tier 1 (CET1) capital, declining loan losses and credit costs, and solid profitability lend credibility to their soundness and ability to lend to households and businesses as well as absorb losses in the event of downside risks (Chart 1.45 a, b, c and d). 1.55 Notwithstanding the solid performance of banks during the last three years, they could face some pressure in the near-term: (1) easing monetary policy cycle could impact the net interest margin (NIM) as growing share of loan book is linked to the external benchmark-based lending rate (EBLR), which is reset more frequently with change in repo rate. On the other hand, term deposits, which are also growing, have fixed contractual rates that change less frequently (Chart 1.46 a). The recent 100 bps cut in CRR, however, will cushion this impact by releasing funds for banks and reducing their costs; (2) credit growth has slowed, and credit impulse43 has turned negative (Chart 1.46 b). Economic slowdown, if any, amidst heightened uncertainty could drag credit demand lower, which may impact asset quality and profitability; and (3) banks’ liability profile is changing with the share of higher-cost term deposits and CDs growing compared to low-cost current account and savings account (CASA) deposits (Chart 1.46 c).   1.56 Post-pandemic, bank loan growth was largely driven by lending to the retail and services sector, particularly through unsecured retail loans and lending to the NBFCs. Pursuant to the RBI’s decision to increase risk weights on certain segments of consumer credit and bank lending to the NBFCs, loan growth in these two sectors has fallen sharply, contributing to a slowdown in total loan growth (Chart 1.47 a and b). Overall, a more cautious approach by lenders, improvement in lending standards, and the restoration of risk weights on bank lending to NBFCs44 are stability-enhancing and credit positive.  1.57 Even as unsecured retail lending has moderated – it forms 25.0 per cent of retail loans and 8.3 per cent of gross advances – its asset quality has relatively weakened compared to the overall retail portfolio - gross non-performing asset (GNPA) ratio at 1.8 per cent vis-à-vis 1.2 per cent in March 2025 - especially in respect of private sector banks (PVBs) (Chart 1.48 a and b). On the other hand, the SMA ratio, an indicator of possible stress build-up in loan book, has risen, led by public sector banks (PSBs) (Chart 1.48 c).   1.58 Slippages in unsecured retail loans remain elevated for PVBs. Fresh slippage in unsecured retail loans continues to dominate the overall slippage in retail loan segment with PVBs’ contribution significantly higher among bank groups (Chart 1.49 a). Alongside, write-offs continue to remain a key contributing factor to NPA reduction in the unsecured retail portfolio, especially among PVBs (Chart 1.49 b, c and d). ") ") 1.59 The share of floating rate loans in total gross advances of fourteen select banks, accounting for around 79 per cent of the assets of SCBs (excluding SFBs and regional rural banks), has increased from 72.0 per cent in March 2023 to 75.7 per cent in March 2025. The share of floating rate loans in the retail loan category rose from 60.2 per cent to 65.1 per cent during the same period - out of this, around 90 per cent are EBLR loans (Table 1.3 and 1.4). Thus, with faster transmission of monetary policy, the debt service burden of retail borrowers is expected to ease. 1.60 Despite a broad deceleration in bank credit growth, the share of credit to the micro, small and medium enterprises (MSME) sector in total non-food bank credit has been growing steadily and its growth has outpaced that in other sectors during 2024-25 (Chart 1.50 a and b). Within the MSME sector, however, credit to the micro enterprises, which formed 49.0 per cent of total credit to the MSME sector, witnessed slower incremental growth in 2024-25 compared to small and medium enterprises (Chart 1.50 c and d). 1.61 Asset quality has shown improvement with gross NPA ratio of MSME portfolio of SCBs falling from 4.5 per cent in March 2024 to 3.6 per cent as at end-March 2025 (Chart 1.51 a). This is also reflected in the significant moderation in SMA-2 ratio, an indicator of incipient stress (Chart 1.51 b). 1.62 In terms of amount outstanding, the share of sub-prime borrowers in the MSME portfolio of the SCBs has decreased from 33.5 per cent in June 2022 to 23.3 per cent in March 2025. PSBs, however, had a higher share of sub-prime borrowers in their MSME portfolio compared to PVBs and NBFCs (Chart 1.52 a and b).   1.63 The government’s credit guarantee schemes improved flow of credit to the MSME sector, especially vulnerable enterprises, with approximately ₹6.28 lakh crore guaranteed under two flagship schemes, viz., the Credit Guarantee Fund for Micro Units (CGFMU) and the Emergency Credit Line Guarantee Scheme (ECLGS). The NPA ratio in both schemes remains contained despite the riskiness of borrowers (Chart 1.53). 1.64 Consumer segment loans grew at a CAGR of 20.4 per cent between March 2021 and March 2025 compared to 14.6 per cent growth in the overall loans. During this period, loans extended by banking sector to this segment grew at a CAGR of 18.8 per cent (Chart 1.54 a). Consumer segment loan growth, however, has slowed following the implementation of regulatory measures by the RBI in Q3:2023-24, across lender types, product types and credit active consumers (Chart 1.54 b, c and d). ")  1.65 Even as loan growth to consumer segment slowed down, the quality of the portfolio has improved. Delinquency levels, except credit cards, have decreased, upgradations from SMA-2 accounts have risen, and slippages from SMA-2 accounts have fallen (Chart 1.55 a, b and c). The GNPA ratio of the SCBs’ consumer segment loans stood at 1.4 per cent in March 2025. Moreover, in a sign of improving underwriting standards, the share of borrowers rated prime and above increased for both PSBs and PVBs (Chart 1.56).   1.66 With the microfinance sector under stress, credit to the sector decreased by 13.9 per cent in 2024-25 (Chart 1.57). Adoption of tighter underwriting standards by the lenders was the primary driver behind deceleration in credit growth, which also resulted in a decrease in total active borrowers by 40 lakhs. Bank credit45 to the sector, which forms 48.3 per cent of total credit outstanding to the sector, contracted by 13.8 per cent in 2024-25.    1.67 The ratio of stressed assets in the microfinance sector increased in H2:2024-25, with 31-180 days past due (dpd) rising from 4.3 per cent in September 2024 to 6.2 per cent in March 2025 (Chart 1.58 a). The banking sector also saw an increase in stress in their microfinance loan book with 31-180 dpd rising from 4.7 per cent in September 2024 to 6.5 per cent in March 2025. However, borrower indebtedness, measured by the share of borrowers availing loans from three or more lenders, is showing a declining trend (Chart 1.58 b). 1.68 Overall, the resilience of the banking system has improved, as indicated by the banking stability indicator (BSI), which strengthened during H2:2024-25 (Chart 1.59 a). All the dimensions of the BSI, except profitability, improved during the period (Chart 1.59 b).  I.5 Non-Bank Financial Intermediaries (NBFIs) I.5.1 Global NBFIs 1.69 Over the last two decades, the non-bank financial sector has become an important provider of financial intermediation, and the assets of NBFIs have grown substantially relative to banks (Chart 1.60). According to the Financial Stability Board (FSB), of the estimated US$ 486.4 trillion global financial assets as at end-December 2023, the share of NBFIs rose to 49.1 per cent, growing at more than double the pace of banking sector46. 1.70 The rapid growth in the non-bank financial sector, however, has been accompanied by excessive use of leverage. Global hedge funds have significantly increased their use of synthetic leverage through derivatives over the past decade, which stands above 20 for multiple strategies (Chart 1.61). Similarly, asset managers, another prominent set of NBFIs, have also increased their leverage through long futures positions in the US treasury and equity markets to enhance their returns.  1.71 The recent market turmoil following April 2 tariff announcement, like previous market stress episodes such as the dash-for-cash episode of March 2020, has once again exposed risks posed by NBFIs globally due to their high leverage. Sudden shocks can trigger forced unwinding of leveraged positions, bringing to the fore hidden fragilities, and cause broader market disruptions47. 1.72 As the prominence of NBFIs in intermediation has grown globally, their growing interconnectedness and interdependence with the banking sector is a source of systemic risk (Chart 1.62 a and b). The growth of NBFIs has coincided with increasing asset-liability dependencies with banks48. Banks extend credit to or invest in NBFIs even as NBFIs rely on banks for their liquidity needs. Moreover, as banks and NBFIs adopt similar business models, the commonality of exposures of banks and NBFIs could amplify market stress49, especially if NBFIs resort to firesales as seen in the September 2022 pension fund crisis in the U.K. Thus, there are risks of both spillovers and spillbacks due to the growing bank- NBFI interconnectedness.   I.5.2 Domestic NBFIs 1.73 The bank-NBFI interconnectedness in India has also grown as the footprint of NBFIs increased over the years. However, prudent and proactive regulatory policies have ensured that the build-up of bank-NBFI connections remain contained (Chart 1.63 a and b).  1.74 The NBFC sector50 remains healthy with strong capital buffers, robust interest margins and earnings and low levels of impairment (Chart 1.64). Loan growth moderated as the effects of regulatory measures to increase risk weights on certain segments of consumer credit as well as on bank lending to NBFCs continued to weigh on their lending activities (Chart 1.65 a, b and c). The restoration of risk weights on bank lending and easing of financial conditions, however, are expected to improve credit prospects. 1.75 NBFCs, including housing finance companies (HFCs), and fintech51 firms account for 84.3 per cent of personal loans below ₹50,000 (Chart 1.66 a). Around 10 per cent of the borrowers availing a personal loan under ₹50,000 had an overdue personal loan. Moreover, a little over two-thirds of borrowers who have availed personal loan in the last quarter had more than three live loans at the time of origination (Chart 1.66 b).  1.76 Combined credit from NBFCs and NBFC-MFIs to the microfinance sector, which comprise 50.7 per cent of total credit outstanding to the sector, contracted by 14.5 per cent during 2024-25. Furthermore, the share of stressed assets of NBFCs (including NBFC-MFIs) increased from 3.9 per cent in September 2024 to 5.9 per cent in March 2025.   1.77 Slippage ratios have been trending upwards, especially in respect of upper layer NBFCs (Chart 1.67 a). Alongside, the write-offs are also growing (Chart 1.67 b). There are a few outlier NBFCs that have been registering sharper growth even as their write-offs remain high (Chart 1.67 c).  1.78 Despite decrease in bank lending to NBFCs, bank finance remains the dominant source of funding for NBFCs (Chart 1.68 a). The decline in borrowings from banks increased overall cost of funds (Chart 1.68 b). Many NBFCs have increased their foreign currency borrowings to diversify funding sources and manage their costs (Chart 1.68 c). Importantly, close to 80 per cent of these borrowings are hedged. 1.79 There has been a marginal deterioration in the non-banking stability indicator (NBSI)52 since the December 2024 FSR, as two of the five dimensions showed an increase in risk (Chart 1.69 a and b). 1.80 Overall, the NBFC sector remains resilient, and the sector is well positioned to support economic growth aided by healthy balance sheets. The sector, however, remains vulnerable to stress in household balance sheets with attendant consequences for asset quality (retail loan GNPA stood at 3.1 per cent compared to 1.2 per cent for banks in March 2025) and a rise in funding cost due to difficulty in diversifying funding sources, especially for lower-rated companies.  Borrowing and Funding Profile")  Mutual Funds 1.81 The assets under management (AUM) of the domestic mutual funds industry continued to grow and reached a record high of ₹72.2 lakh crore in May 2025 (Chart 1.70). Systematic investment plans (SIPs), on the other hand, saw some slowdown in recent months, both in terms of net contributions and accounts (Chart 1.71). The decline in accounts could be attributed to asset management companies (AMCs), pursuant to a SEBI directive, considering the failed SIPs53 as closed/cancelled from the month of January 2025.  1.82 Among different equity-oriented schemes, sectoral/thematic funds have attracted largest inflows over the last year and half, except in the last three months (Chart 1.72 a and b). In debt-oriented schemes, on the other hand, liquid and money market funds attracted more inflows during October 2024 to May 2025 (Chart 1.72 c).   I.6 Systemic Risk Survey (SRS) 1.83 According to the latest round of the Reserve Bank’s systemic risk survey (SRS) conducted in May 2025, all major risk groups remain in the ‘medium-risk’ category. Global and institutional risks were perceived to have increased compared with the previous survey round, whereas macroeconomic and financial market risks registered a marginal decline. At sub-category level, the risk perception of global growth and geopolitical conflict/ geoeconomic fragmentation recorded the most significant increase and were assessed as ‘high-risk’. Other major risks perceived to be in the ‘high-risk’ category include equity price volatility, climate risk and cyber risk. Overall, the survey respondents viewed geopolitical conflicts, capital outflows and reciprocal tariff/ trade slowdown as major near-term potential risks to financial stability (Chart 1.73). 1.84 Around two-thirds of the respondents expressed decreasing confidence in the stability of the global financial system. On the other hand, over 90 per cent of the participants expressed higher or similar confidence in the Indian financial system, with three-fourths expecting trade tension and protectionist policies to have moderate impact on India’s financial stability. Respondents assessed that export-dependent manufacturing sectors (e.g., textiles, readymade garments, electronics), MSMEs in export clusters and shipping and logistics industry would be the most affected by the global trade disruption.  1.85 About 80 per cent of the respondents perceived that the prospects of Indian banking sector have either improved or remain unchanged, underlining the resilience and strength of the sector. Almost 60 per cent of participants expected the asset quality of the banking sector to improve or remain unchanged in the following six months. Majority of the respondents perceived the trade slowdown to have a moderate to low impact on banking sector asset quality. Around 53 per cent of the respondents assessed the demand for credit to improve in the near-term owing to uptick in rural demand, better business sentiments and improved health of banks. Detailed survey results are provided in Annex 1. 1 As per the OECD’s Economic Outlook Report, June 2025, the new tariffs introduced by the United States this year up to mid-May are estimated to have raised the (ex-ante) effective tariff rate on US merchandise imports to 15.4 per cent, from just over 2 per cent in 2024. 2 Gourinchas, Pierre-Olivier (2025), “The Global Economy Enters a New Era”, IMF Blog, April. 3 International Monetary Fund (2025), “World Economic Outlook: A Critical Juncture amid Policy Shifts”, April. 4 International Monetary Fund (2025), “Global Financial Stability Report: Enhancing Resilience amid Uncertainty”, April. 5 As per the World Bank GEP report, global trade growth is projected to decelerate to 1.8 per cent in 2025, a downward revision of 1.3 percentage points from the previous January 2025 projection. 6 Dabla-Norris, Era, Gaspar, Vitor, Poplawski-Ribeiro, Marcos (2025), “Rising Global Debt Requires Countries to Put their Fiscal House in Order”, IMF Blog, April. 7 Dabla-Norris, Era and Furceri, Davide (2025), “Debt is Higher and Rising Faster in 80 Per cent of Global Economy”, IMF Blog, May. 8 ARG: Argentina; AUS: Australia; BRA: Brazil; CAN: Canada; CHN: China; DEU: Germany; FRA: France; GBR: United Kingdom; IDN: Indonesia; IND: India; ITA: Italy; MEX: Mexico; MYS: Malaysia; PHL: Philippines; THA: Thailand; TUR: Republic of Türkiye; USA: United States; ZAF: South Africa. 9 AUS: Australia; BRA: Brazil; CAN: Canada; CHN: China; DEU: Germany; FRA: France; GBR: United Kingdom; IDN: Indonesia; IND: India; ITA: Italy; MEX: Mexico; MYS: Malaysia; PHL: Philippines; TUR: Turkey; USA: United States; ZAF: South Africa. 10 Adrian, Tobias, Nikolaou, Kleopatra, Wu, Jason (2025), “Fostering Core Government Bond Market Resilience, IMF Blog, May. 11 Growth outturn refers to the actual economic growth compared to what was originally forecast. 12 Reserve Bank of India (2025), “Monetary Policy Statement”, June. 13 Reserve Bank of India (2025), “Monetary Policy Report”, April. 14 Reserve Bank of India (2025), “Annual Report”, May. 16 Patra, Michael Debabrata, Behera, Harendra and Muduli, Silu (2022), “Capital Flows at Risk: India’s Experience”, RBI Bulletin, June. 17 Adrian, Tobias (2025), “Enhancing Financial Stability for Resilience During Uncertain Times”, IMF Blog, April. 18 The Federal Reserve Board (2025), “Financial Stability Report”, April. 19 Financial Stability Board (2022), “Liquidity in Core Government Bond Markets”, October. 20 Barth, Daniel, Kahn, R. Jay, and Mann, Robert (2023), “Recent Developments in Hedge Funds’ Treasury Futures and Repo Positions: is the Basis Trade Back?”, FEDS Notes, Washington: Board of Governors of the Federal Reserve System, August. 21 Kashyap, Anil K, Stein, Jeremy C., L. Wallen, Jonathan, and Younger, Joshua (2025), “Treasury Market Dysfunction and the Role of the Central Bank”, BPEA Conference Draft, March. 22 Iorio, Benjamin, Li, Dan, and Petrasek, Lubomir (2024), “Why Do Mutual Funds Invest in Treasury Futures?”, FEDS Notes, Washington: Board of Governors of the Federal Reserve System, May. 23 International Monetary Fund (2025), “Global Financial Stability Report: Enhancing Resilience amid Uncertainty”, April. 24 Shin, Hyun Song, Wooldridge, Philip and Xia, Dora (2025), “US dollar’s slide in April 2025: the role of FX hedging”, BIS Bulletin No. 105, June. 25 Bull steepening refers to a change in the yield curve caused by short-term interest rates falling faster than long-term rates, widening the spread between the two, that is, the term spread. 26 Semi-liquid securities have average of 1-10 trades (of face value>=₹5 crore) per day during previous calendar month. Illiquid securities have average of less than 1 trade (of face value>=₹5 crore) per day during previous calendar month. 28 According to the Institute of International Finance (IIF), foreign portfolio outflows from EMEs at ~US$ 40 billion in the December 2024 quarter were the highest since the pandemic (Q1:2020 - US$ 62.8 billion). 29 Institute of International Finance (2025), “Capital Flows Tracker”, February. 30 Fendoglu, Salih, Mahvash S. Qureshi, and Felix Suntheim (2025), “How Rising Geopolitical Risks Weigh on Asset Prices”, IMF Blog, April. 32 The interest coverage ratio is the ratio of earnings before interest and taxes (EBIT) to interest expenses. 33 The debt service ratio is defined as the ratio of interest payments plus amortisations to income. As such, the DSR provides a flow-to-flow comparison – the flow of debt service payments divided by the flow of income and therefore reflects the share of income used to service debt. 34 Cash buffers are defined as cash and cash equivalent assets as a percentage of total financial liabilities. 35 After adjusting for natural hedge. 36 Includes personal loans, credit cards, consumer durable loans and other personal loans. 37 In this analysis, consumer segment loans are used as a proxy for the total household debt and represents about 94 per cent of total household debt as at end-December 2024. Consumer segment loans refer to credit that is extended to individuals in their personal capacity, utilised for either personal or business purposes, and is recorded in the consumer repository of credit bureau(s). 38 Debt outstanding divided by number of live unique borrowers at the end of each period. 39 The segregation of risk tiers based on CIBIL scores is as follows - Super-Prime:791-900; Prime Plus: 771-790, Prime: 731-770; Near Prime: 681-730; and Sub-Prime: 300-680. 40 Prakash, Anupam, S, Suraj, Thakur, Ishu and Priyadarshini, Mousumi (2024), “Estimating the Financial Wealth of Indian Households”, RBI Bulletin, July. 41 The analyses done in this section are based on domestic operations of SCBs (including SFBs), unless otherwise stated. 42 Special mention account (SMA) is defined as: a) For loans with revolving facilities (e.g. cash credit/ overdraft): if outstanding balance remains continuously more than the sanctioned limit or drawing power, whichever is lower, for a period of 31-60 days - SMA-1; 61-90 days - SMA-2. b) For loans other than revolving facilities: if principal or interest payment or any other amount wholly or partly overdue remains outstanding up to 30 days - SMA-0; 31-60 days - SMA-1; 61-90 days - SMA-2. 43 Credit impulse is the change in new credit issued as a percentage of GDP. Essentially, it captures the change in credit between time t and (t-1), and between (t-1) and (t-2), as a percentage of four-period rolling average of quarterly GDP at time (t-1). 44 RBI circular no. RBI/2024-25/120 DOR.STR.REC.61/21.06.001/2024-25 dated February 25, 2025, on “Exposures of Scheduled Commercial Banks (SCBs) to Non-Banking Financial Companies (NBFCs) – Review of Risk Weights”. 45 Including small finance banks (SFBs). 46 FSB (2024), “Global Monitoring Report on Non-Bank Financial Intermediation 2024”, December. 47 International Monetary Fund (2025), “Global Financial Stability Report: Enhancing Resilience amid Uncertainty”, April. 48 Acharya, Viral V., Cetorelli, Nicola and Tuckman, Bruce (2024), “Where do Banks End and NBFIs Begin?”, NBER Working Paper 32316, April. 49 Cetorelli, Nicola, Landoni, Mattia, and Lu, Lina (2023), “Non-Bank Financial Institutions and Banks’ Fire-Sale Vulnerabilities”, Federal Reserve Bank of New York Staff Reports, No. 1057, March. 50 The analyses done in this section are based on NBFCs in upper and middle layers but excludes housing finance companies (HFCs), core investment companies (CICs) and standalone primary dealers (SPDs), but includes NBFCs presently under resolution; data based on provisional data available as of June 10, 2025. 51 The methodology for classifying NBFCs as Fintech is based on TransUnion CIBIL’s market knowledge that they have a digital first approach for its lending business and/or are members of industry bodies like FACE, UFF and IAMAI. 52 See Annex 2 for detailed methodology and variables used. 53 The failed SIPs mean SIPs where 3 consecutive instalments with respect to daily, weekly, fortnightly, and monthly intervals and 2 consecutive instalments with respect to bi-monthly, quarterly or longer intervals have failed. |
 – Global and India")

 Around Geopolitical Events")


Install the RBI mobile application and get quick access to the latest news!


